Fibonacci Retracements Analysis 16.10.2017 (EUR/USD, USD/JPY)
16.10.2017EUR USD, “Euro vs US Dollar”
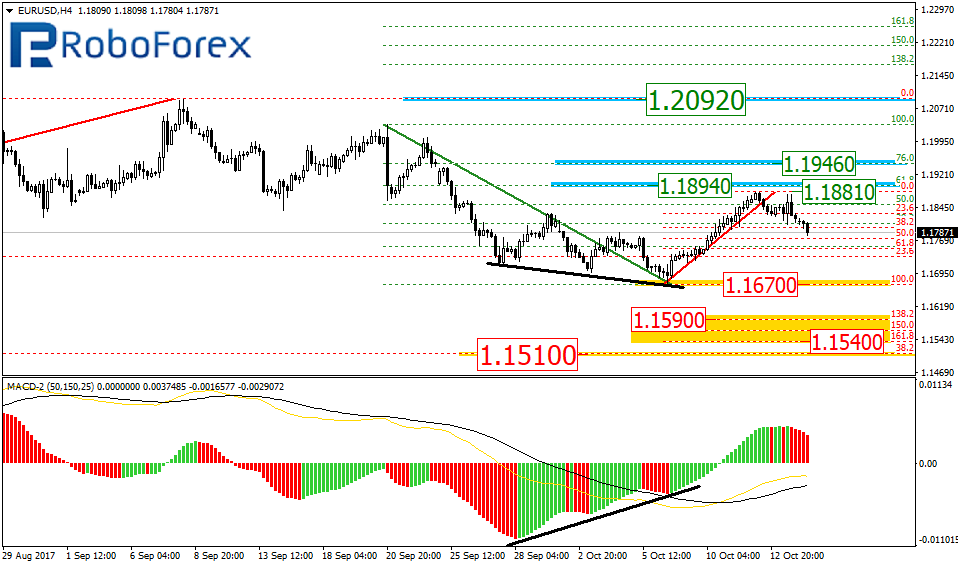
As we can see at the H4 chart, the previous descending impulse has been corrected by 50.0%. The next possible targets of the ascending correction may be the retracements of 61.8% and 76.0 at 1.1894 and 1.1946 respectively. However, as long as the price is trading below the high at 1.2092, the current mid—term movement should be considered as the descending tendency. After the instrument starts a new descending impulse and breaks the low at 1.1670, the targets will be inside the post-correctional extension area between the retracements of 138.2% and 161.8% at 1.1590 and 1.1540 respectively. The more “ambitious” target will at 1.1510.
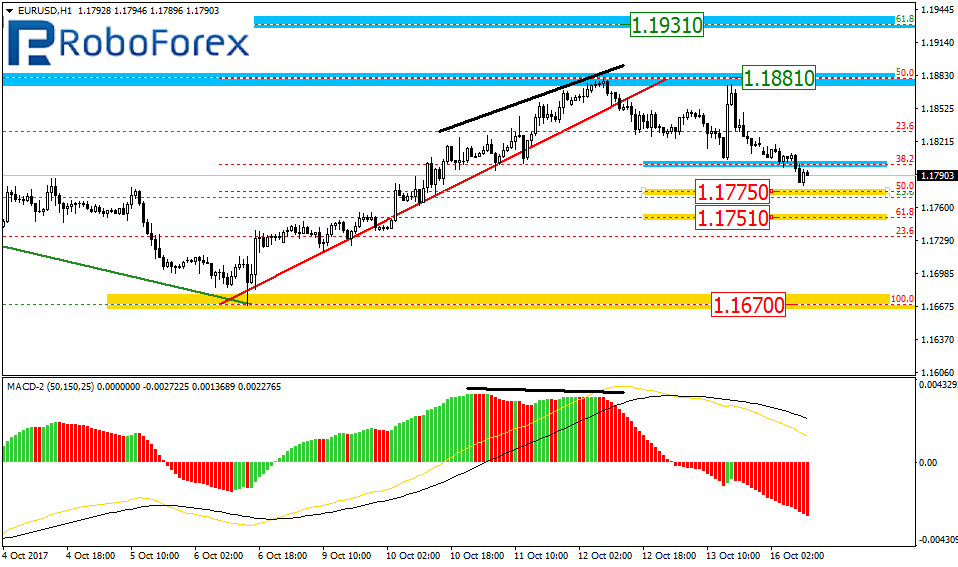
At the H1 chart, the EUR/USD pair is forming a short-term correction with the target at the retracements of 50.0% and 61.8% at 1.1775 and 1.1751 respectively. If the price rebounds from this level and breaks the local high at1.1881, the instrument may resume growing towards 1.1913.
USD JPY, “US Dollar vs. Japanese Yen”
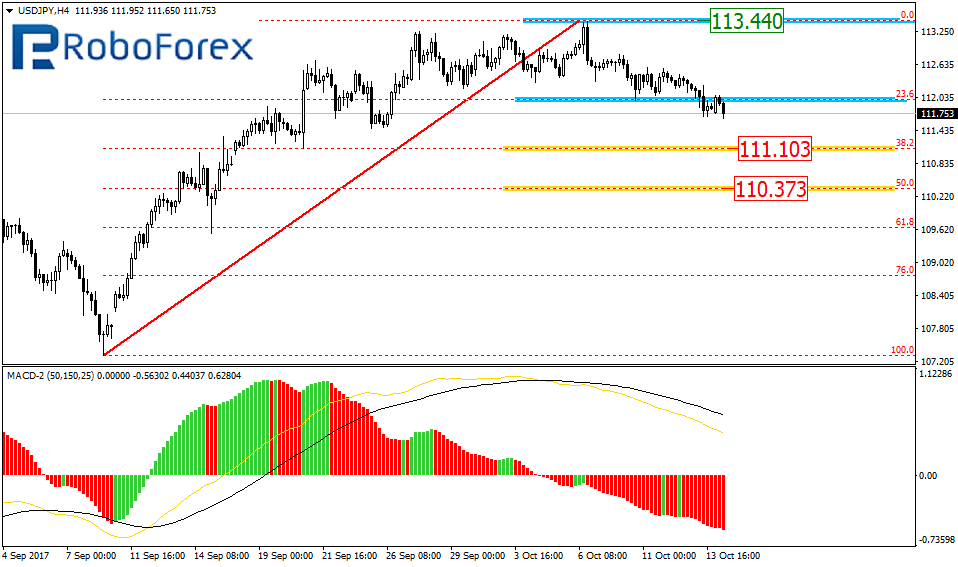
At the H4 chart, the USD/JPY pair is still being corrected. The closest targets of this correction may be the retracements of 38.2% and 50.0% at 111.103 and 110.373 respectively. The resistance level is close to the high at 113.440.
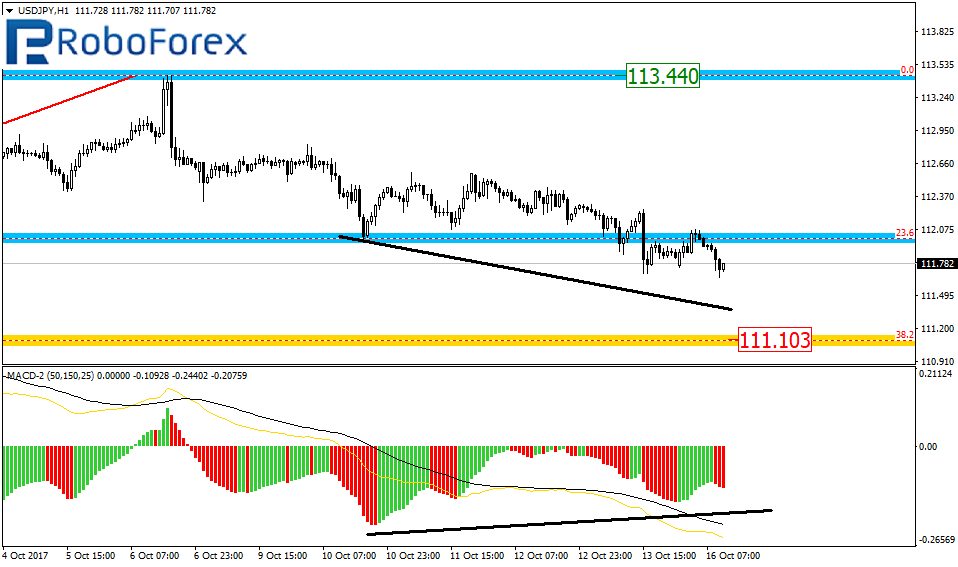
As we can see at the H1 chart, the pair is falling towards the retracement of 38.2% at 111.103. In addition to that, the convergence is being formed, so the price may soon rebound from its target level.
RoboForex Analytical Department
Attention!Forecasts presented in this section only reflect the author’s private opinion and should not be considered as guidance for trading. RoboForex bears no responsibility for trading results based on trading recommendations described in these analytical reviews.