Fibonacci Retracements Analysis 17.06.2021 (Brent, Dow Jones)
Brent
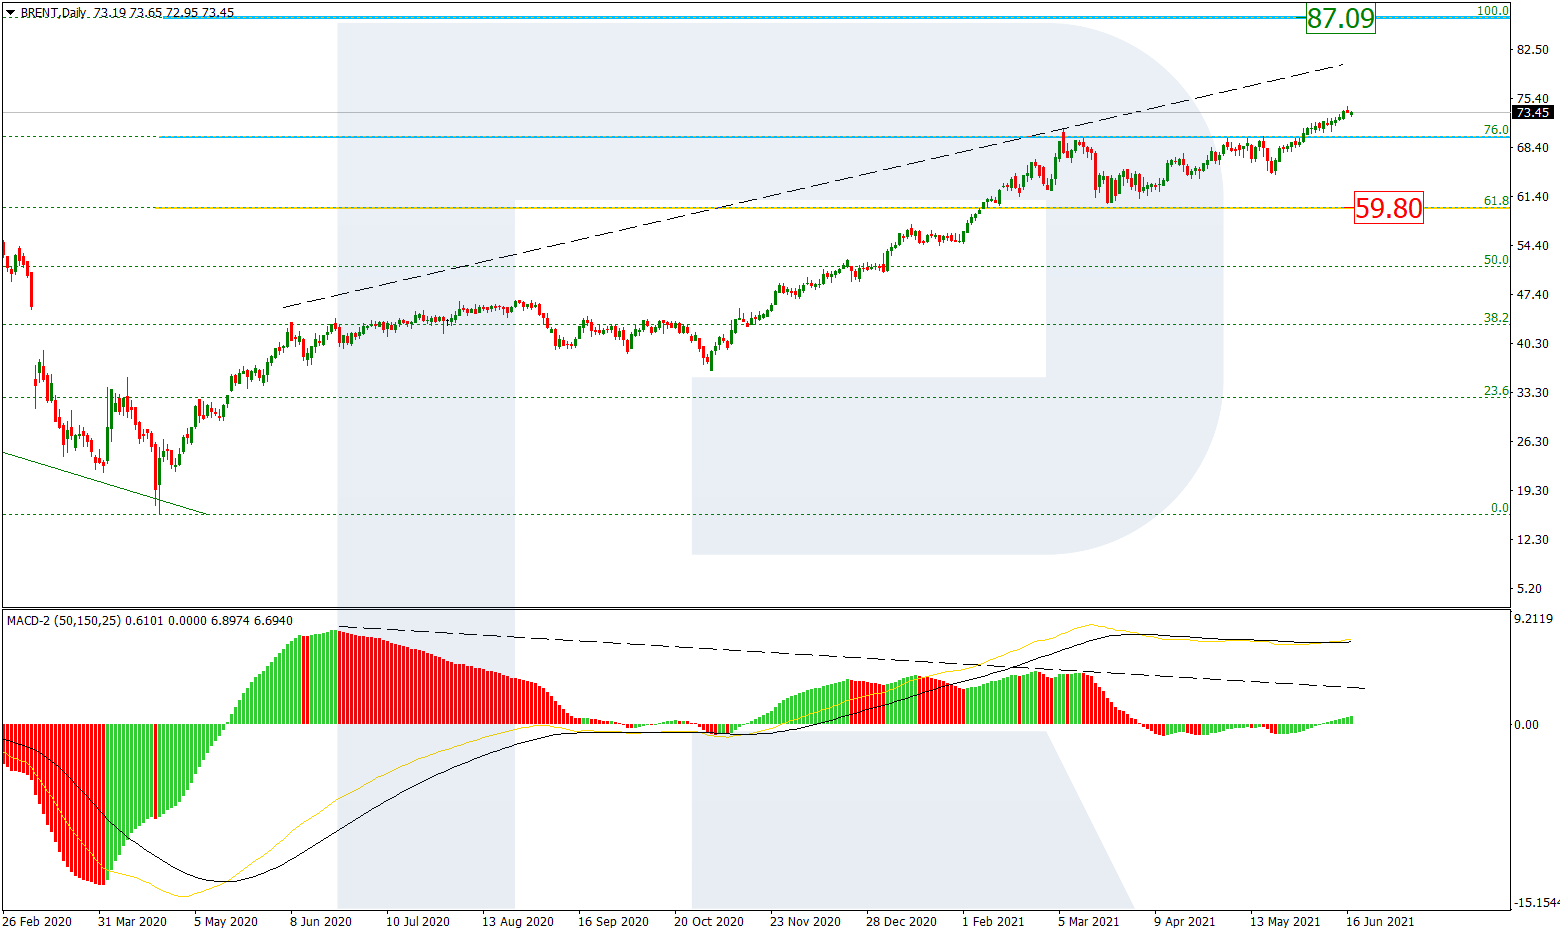
In the daily chart, after breaking 76.0% fibo and updating the high at 71.07, Brent is still growing towards the long-term high at 87.09. However, a divergence on MACD may indicate a possible pullback to reach the local support, which is 61.8% fibo at 59.80.

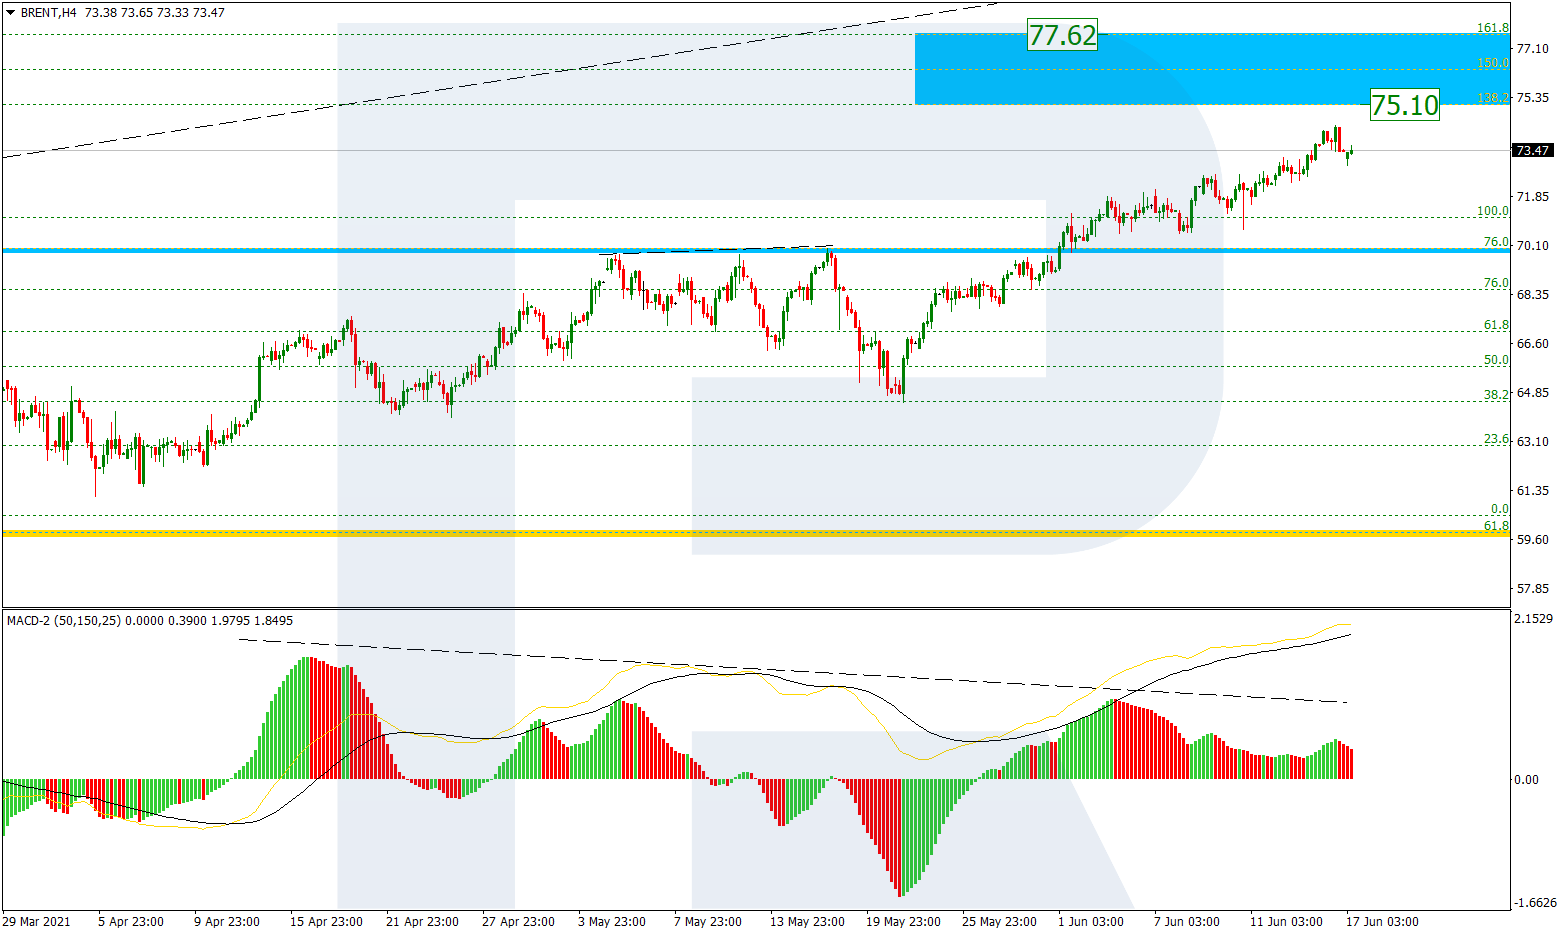
The H4 chart shows an ascending movement towards the post-correctional extension area between 138.2% and 161.8% fibo at 75.10 and 77.62 respectively.
Dow Jones
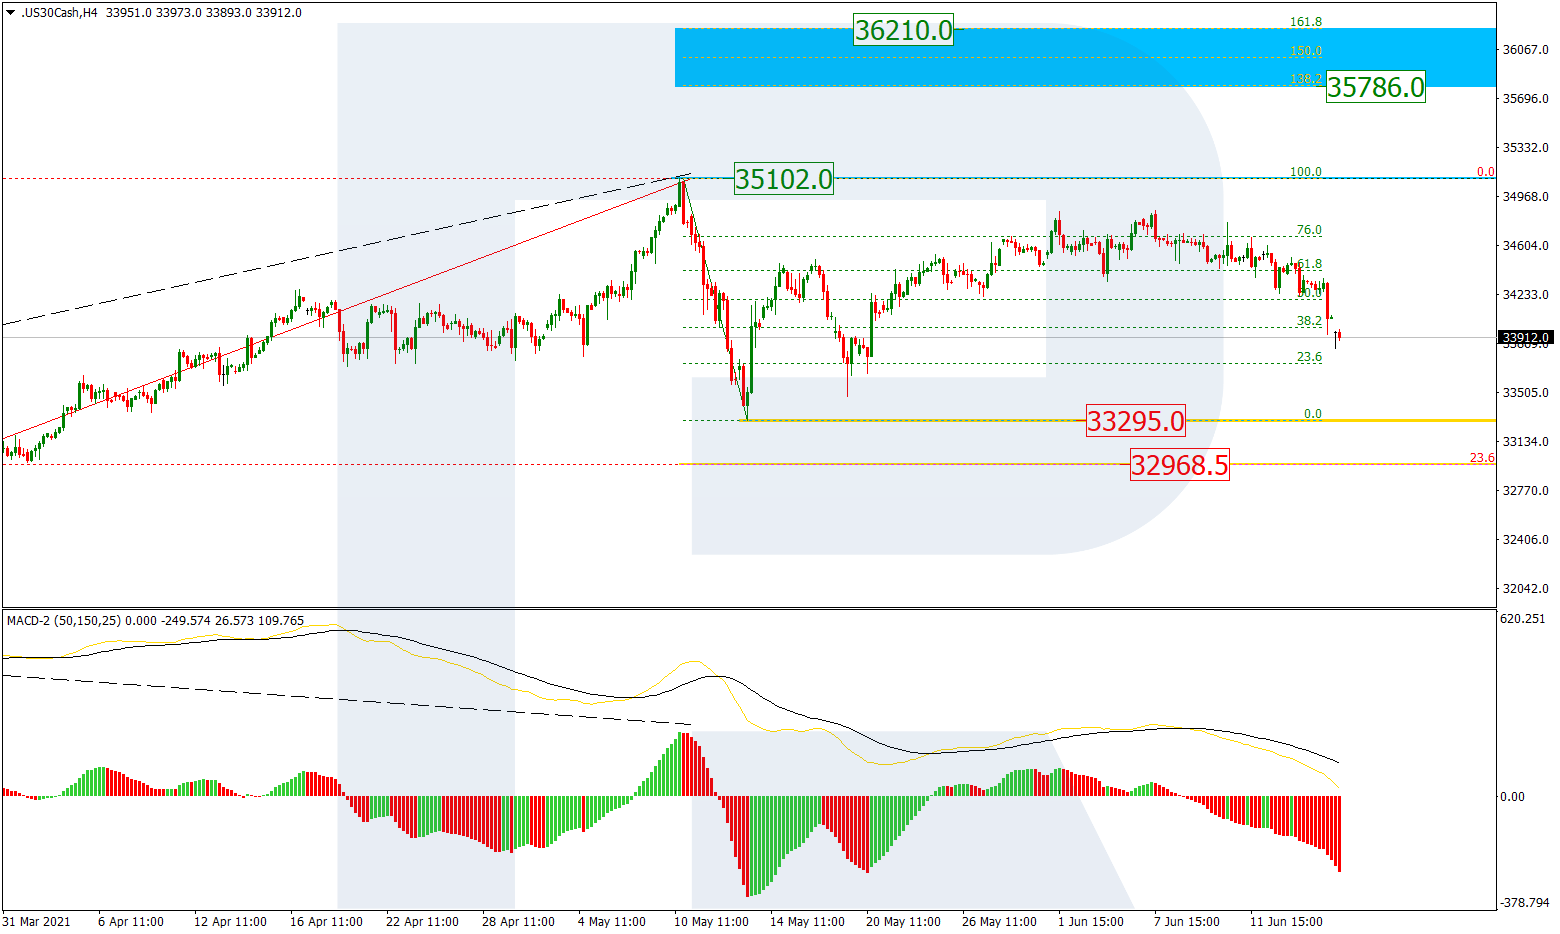
As we can see in the H4 chart, after attempting to reach the high at 35102.0, Dow Jones is falling to break the low at 33295.0 and then continue trading downwards to reach 23.6% fibo at 32968.5. On the other hand, a breakout of the high will lead to a further uptrend towards the post-correctional extension area between 138.2% and 161.8% fibo at 35786.0 and 36210.0 respectively.
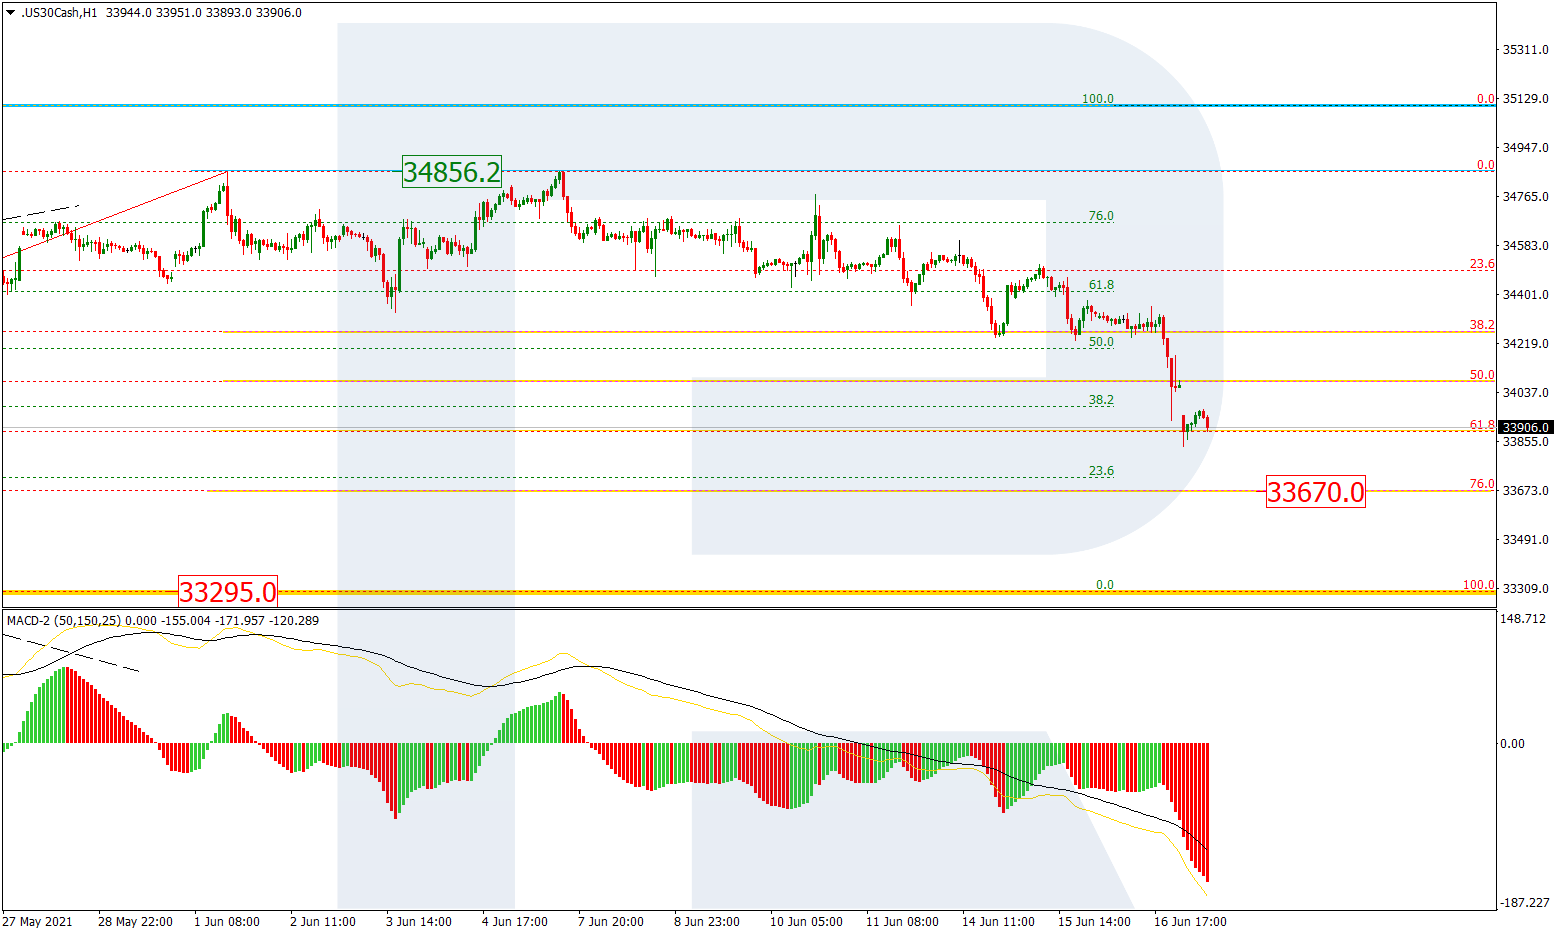
The H1 chart shows a more detailed structure of the current decline after a divergence on MACD, which has already reached 61.8% fibo and is trying to break it. The next downside targets may be 76.0% fibo at 33670.0 and the low. The resistance is the high at 34856.2.
Forecasts presented in this section only reflect the author’s private opinion and should not be considered as guidance for trading. RoboForex bears no responsibility for trading results based on trading recommendations described in these analytical reviews.