Murrey Math Lines 11.06.2019 (AUDUSD, NZDUSD)
AUDUSD, “Australian Dollar vs US Dollar”
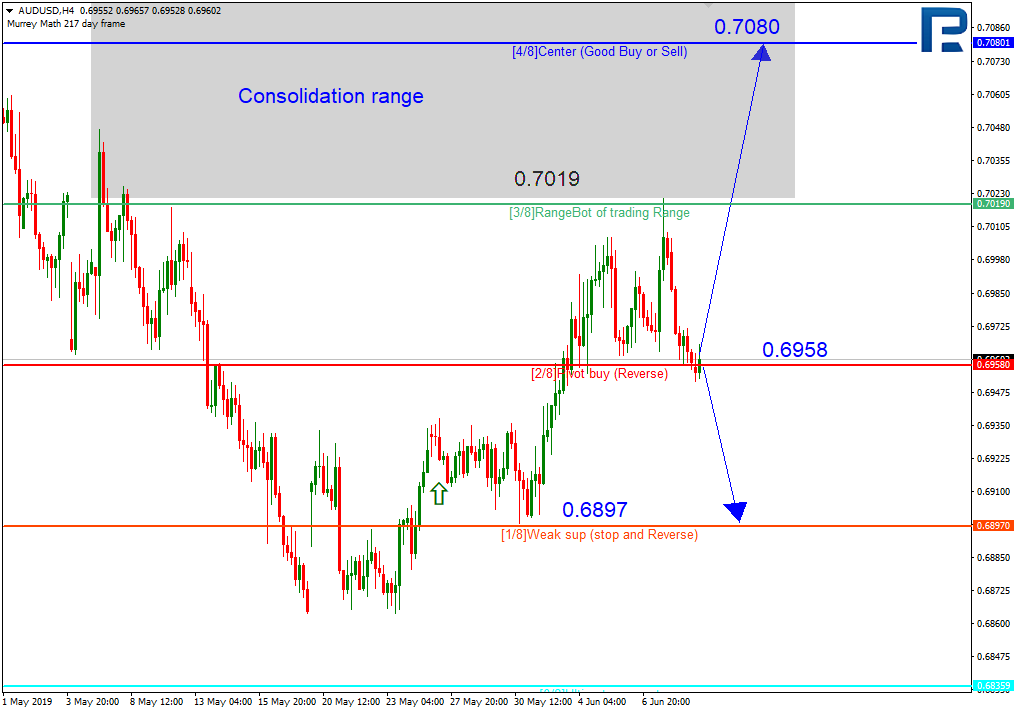
As we can see in the H4 chart, AUDUSD has rebounded from the resistance at 3/8 and may continue falling towards the support at 1/8. To confirm this scenario, the price must break 2/8. However, this scenario may be no longer valid if the pair breaks 2/8 upwards. In this case, the instrument may continue growing to reach resistance at 4/8.

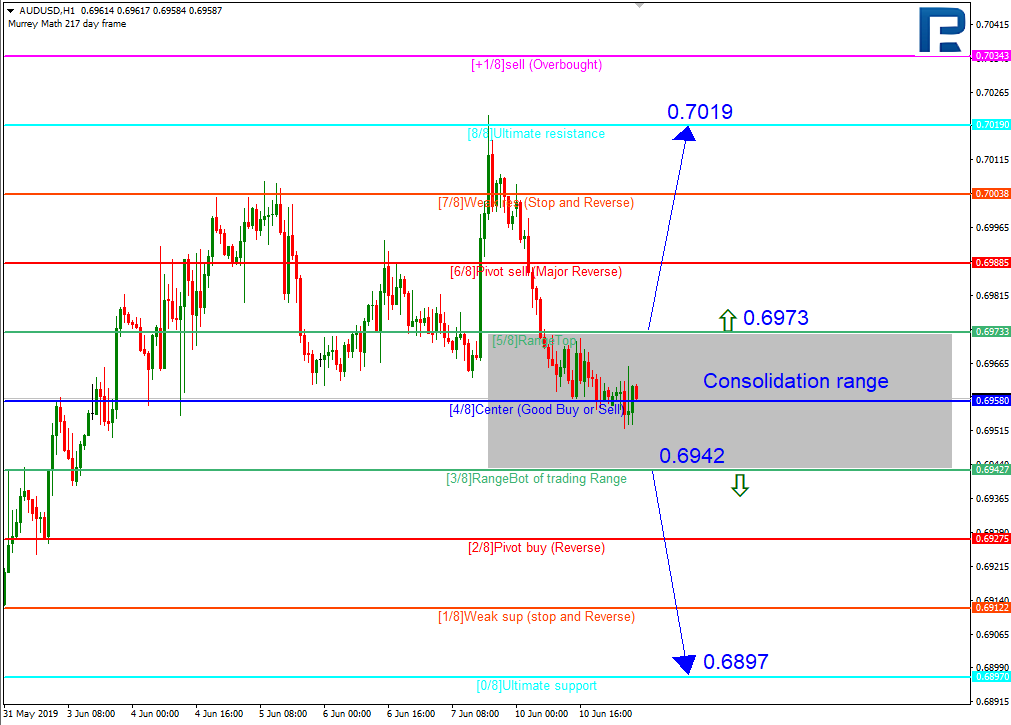
In the H1 chart, the pair is consolidating between 3/8 and 5/8, thus offering two possible scenarios. If the price breaks this range upwards at 5/8, the instrument may resume growing to reach the resistance at 8/8; if downwards at 3/8 – continue falling to reach the support at 0/8.
NZDUSD, “New Zealand Dollar vs US Dollar”
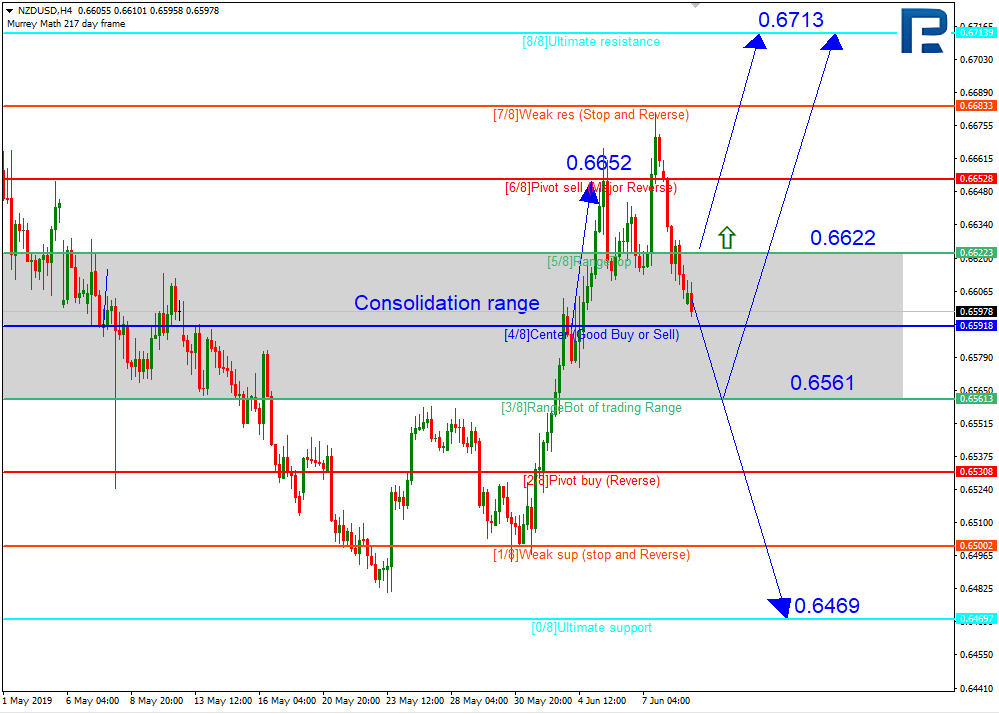
As we can see in the H4 chart, NZDUSD has reached its predicted targets; right now, it is being corrected. Possibly, the pair may test 3/8, rebound from it, and then resume growing to reach the resistance at 8/8. To confirm this scenario, the price must break 5/8. However, this scenario may no longer be valid if the breaks 3/8 downwards. In this case, the instrument may continue falling to reach 0/8.
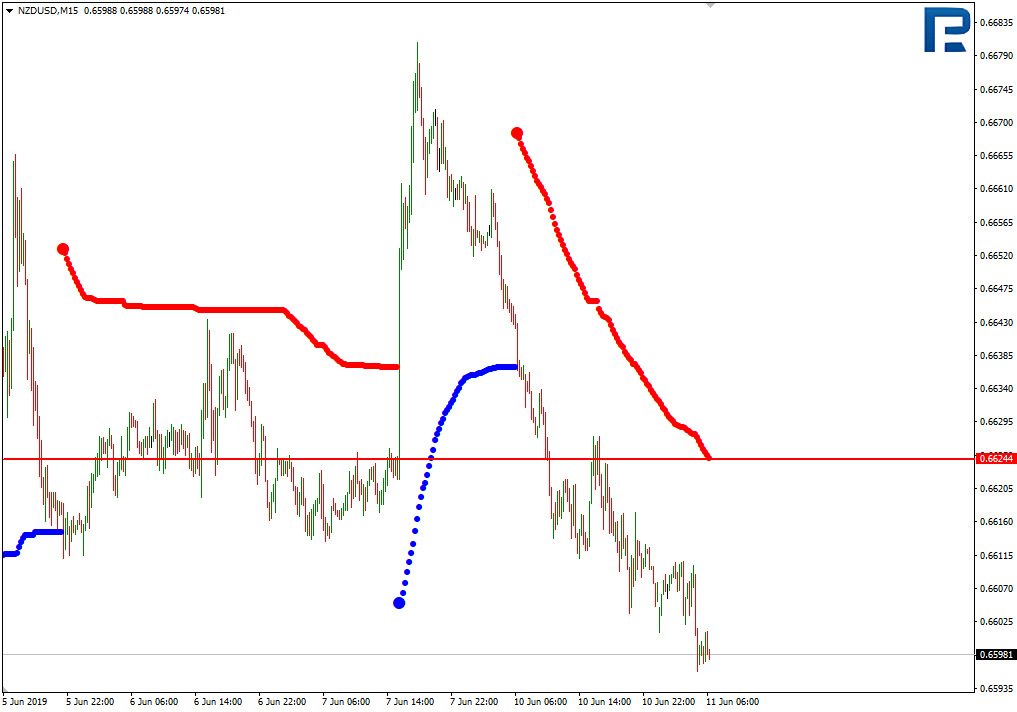
In the M15 chart, the pair may break the upside line of the VoltyChannel indicator and, as a result, continue trading upwards.
Forecasts presented in this section only reflect the author’s private opinion and should not be considered as guidance for trading. RoboForex bears no responsibility for trading results based on trading recommendations described in these analytical reviews.