Murrey Math Lines 31.07.2020 (Brent, S&P 500)
Brent
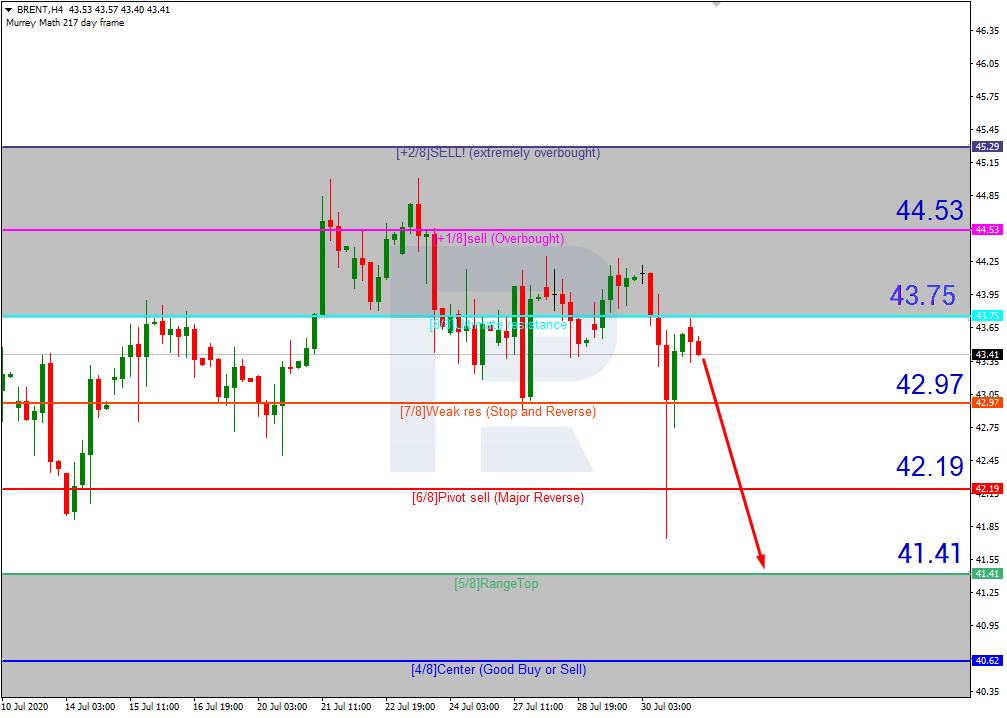
As we can see in the H4 chart, Brent has rebounded from 8/8. In this case, the price is expected to resume falling towards the support at 5/8. However, this scenario may no longer be valid if the price breaks 8/8 to the upside. After that, the instrument may continue growing to reach the resistance at +1/8.

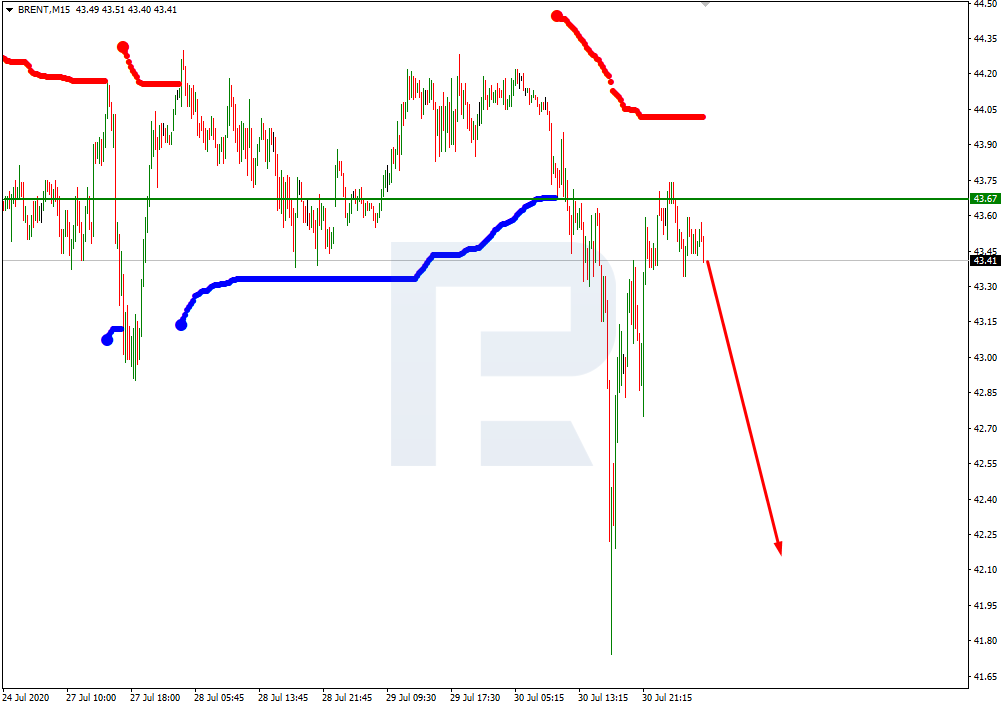
In the M15 chart, the asset may break the downside line of the VoltyChannel indicator and, as a result, continue the descending tendency.
S&P 500
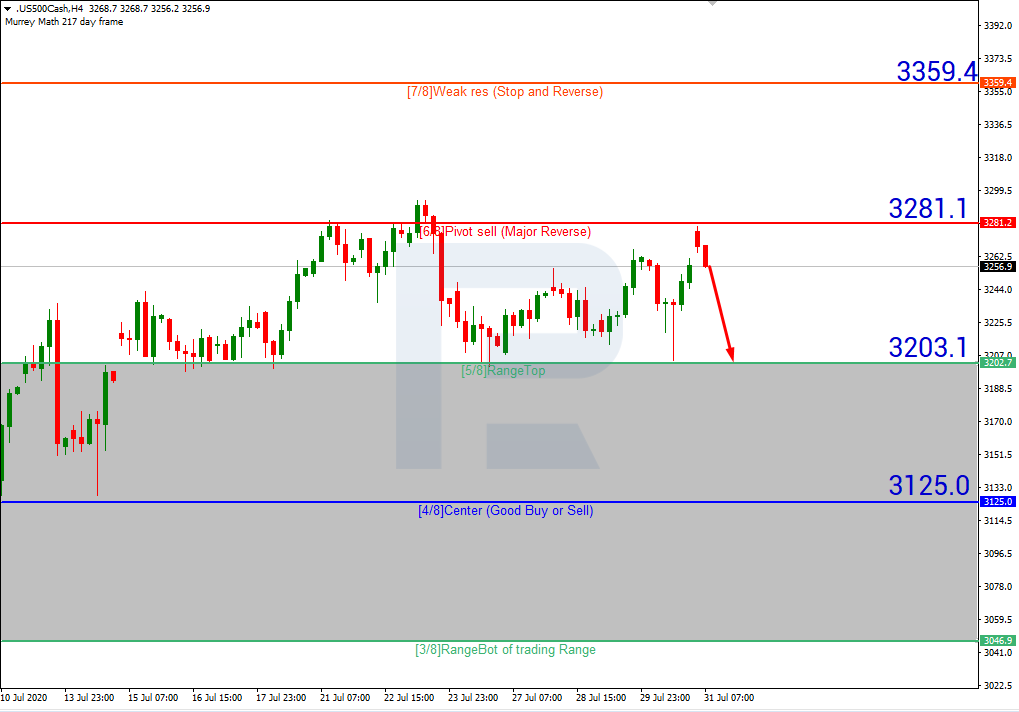
As we can see in the H4 chart, after rebounding from 6/8 again, the Index is expected to start another decline towards 5/8. However, this scenario may no longer be valid if the price breaks 6/8 to the upside. After that, the instrument may resume growing towards the resistance at 7/8.
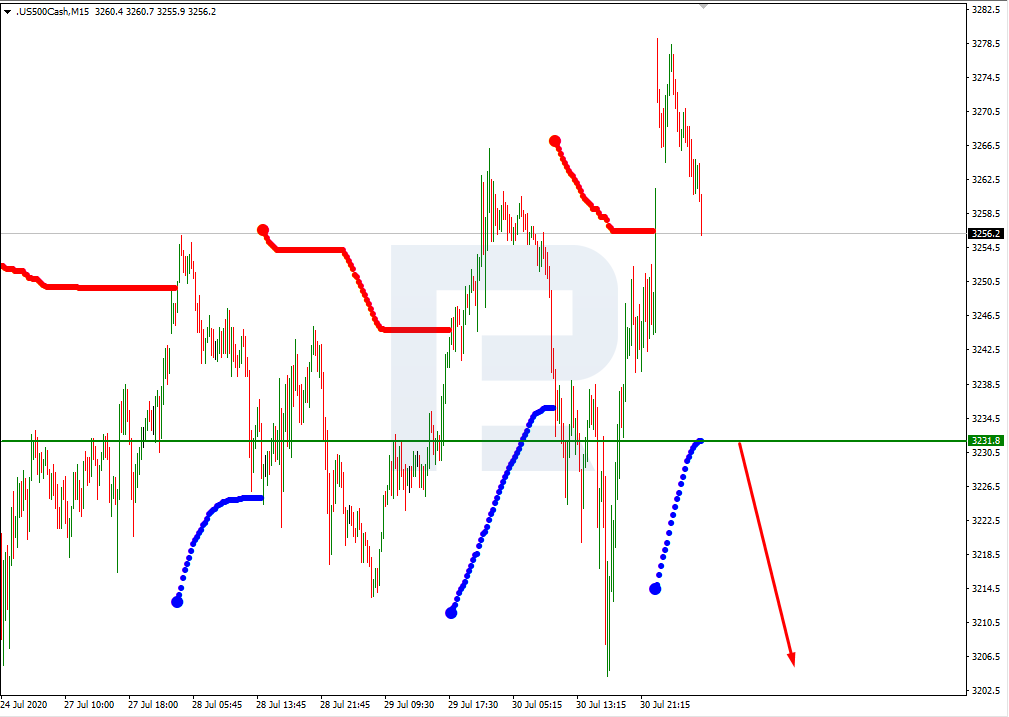
In the M15 chart, the asset may break the downside line of the VoltyChannel indicator and, as a result, continue trading downwards.
Forecasts presented in this section only reflect the author’s private opinion and should not be considered as guidance for trading. RoboForex bears no responsibility for trading results based on trading recommendations described in these analytical reviews.