Forex Technical Analysis 2012/26/06 (EUR/USD, GBP/USD, USD/CHF, USD/CAD, USD/RUB) Forecast FX
25.06.2012
Forecast for June 26th, 2012
EUR/USD
The EUR/USD currency pair has left the ascending channel and the price has completed “double top” reversal pattern. The target of the fall is the area of 1.2380. We should expect Euro to test the area of 1.2540, where one can consider selling it with the tight stop. If the price grows up higher than 1.2590, this scenario will be cancelled.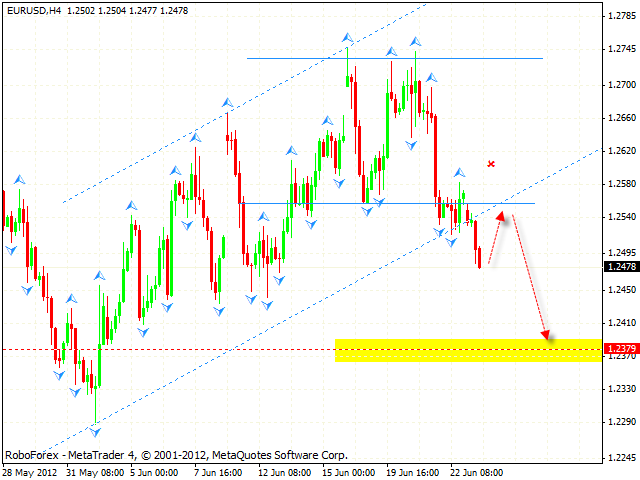
GBP/USD
The GBP/USD currency pair has also broken the ascending channel’s lower border, we should expect it to start moving downwards. Right now the closest target of the fall is the area of 1.5455, one can consider selling Pound near the level of 1.5560. If the price grows up higher than 1.5670, this scenario will be cancelled.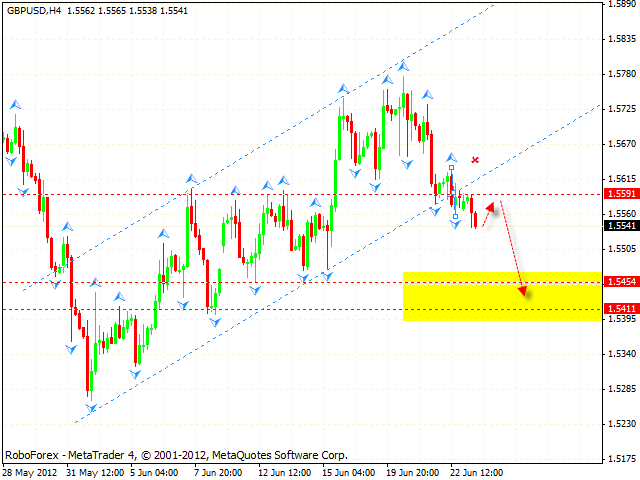
USD/CHF
At the H4 chart of the USD/CHF currency pair the price has formed “double bottom” reversal pattern. The pair has broken the resistance level and left the descending channel. The target of the pattern is the area of 0.9695. One can consider buying Franc near the level of 0.9580. If the price falls down lower than 0.9540, еры scenario will be cancelled.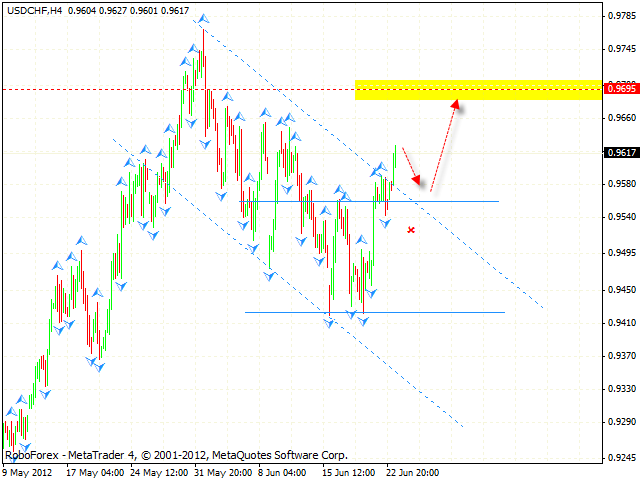
USD/CAD
Canadian Dollar continues moving upwards. The price may test the level of 1.0365, which is expected to be a starting point of the correction into the area of 1.0280. One can consider buying the pair with the tight stop near the channel’s broken border. The target of the growth is the area of 1.0425. If the price falls down lower than 1.0235, this scenario will be cancelled.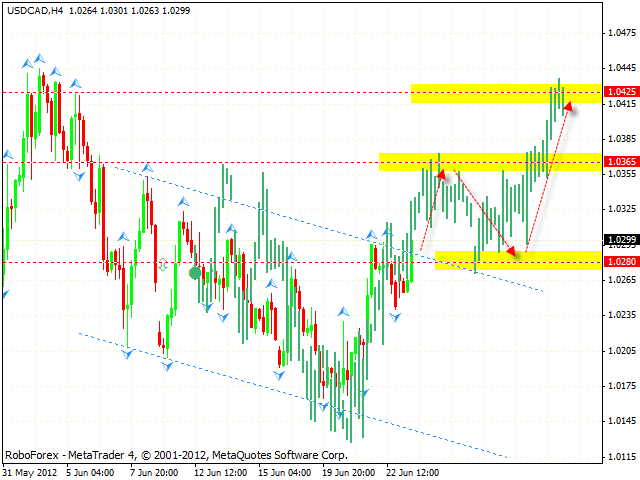
USD/RUB
At the weekly chart the USD/RUB currency pair is still moving inside the descending pattern, there is a possibility that it may start falling down into the area of 28. The test of the trend’s descending line at the RSI is an additional signal to sell the pair.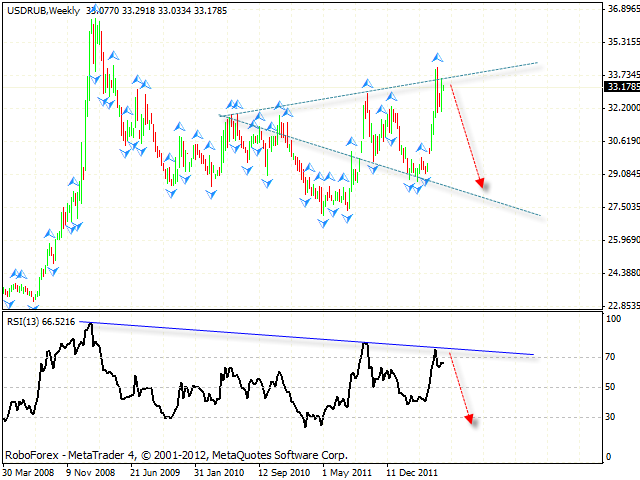
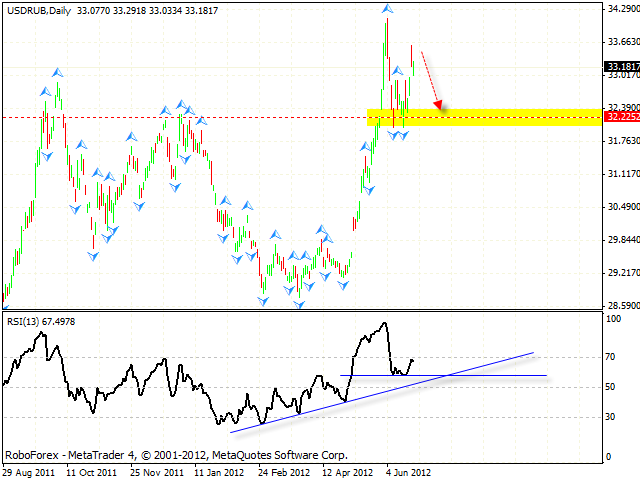
At the daily chart we have “failure swing” reversal pattern forming, the target of the fall is the area of 32.20. One can consider selling the pair aggressively from the current levels.
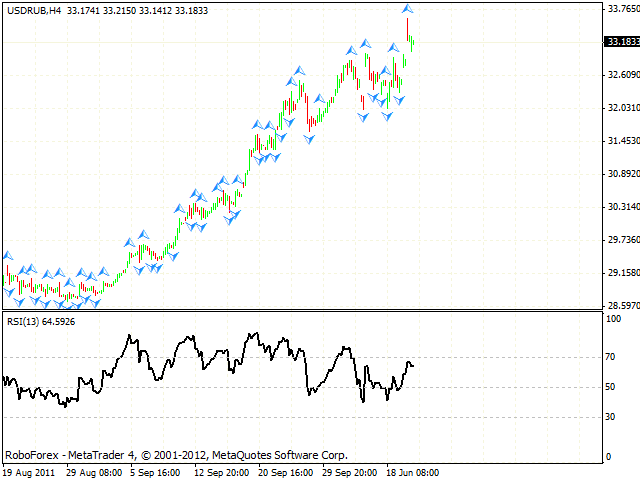
At the H4 chart the RSI indicator is testing the trend’s descending line, we should expect it to rebound and start moving downwards. If the price grows up higher than 34, this scenario will be cancelled.
Attention!
Forecasts presented in this section only reflect the author’s private opinion and should not be considered as guidance for trading. RoboForex bears no responsibility for trading results based on trading recommendations described in these analytical reviews.