Forex Technical Analysis 2010/11/09. EUR/USD, GBP/USD, USD/CHF Forecast FX.
EUR USD Forecast Nov 10 2010
As it seen from eur usd technical analysis the price has broken the rising channel, but the rising trend still remains here. At the daily chart the RSI indicator is testing the rising trend’s line, we should expect the price to hit the line and go back, and, consequently, the pair to grow. In case the trend’s line is broken, the price will move down to the channel’s lower border where we can try to buy the pair with the target of 1.4800.
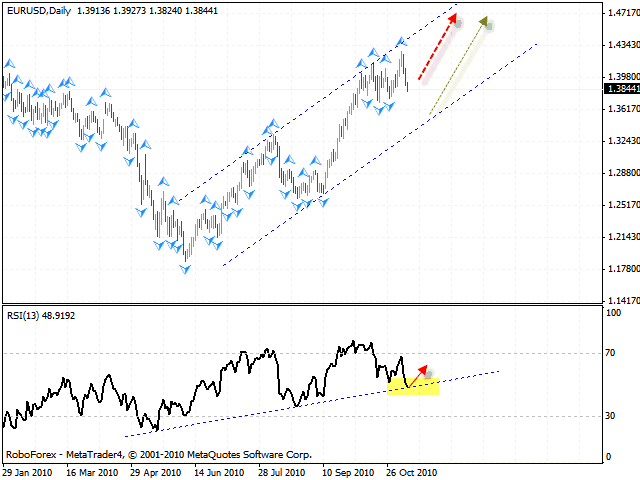
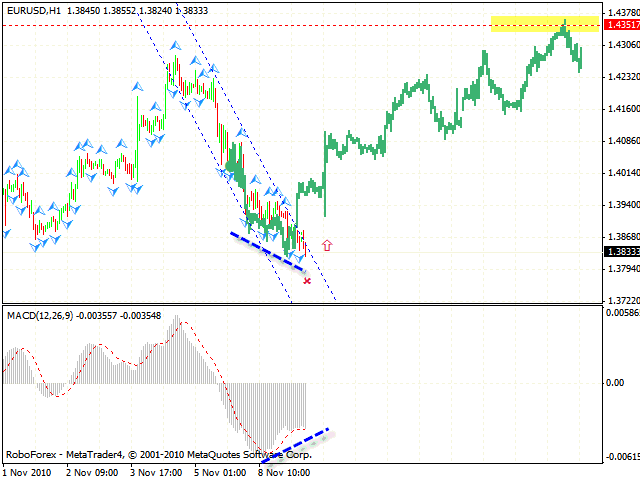
To define the targets of the growth and point of entry let’s take a look at the hourly online forex trading chart. We can see a divergence at the MCAD, which is a signal to buy the pair. The target of the growth is the area of 1.4350. The stop must be hidden behind the local minimum.
GBP USD Forecast Nov 10 2010
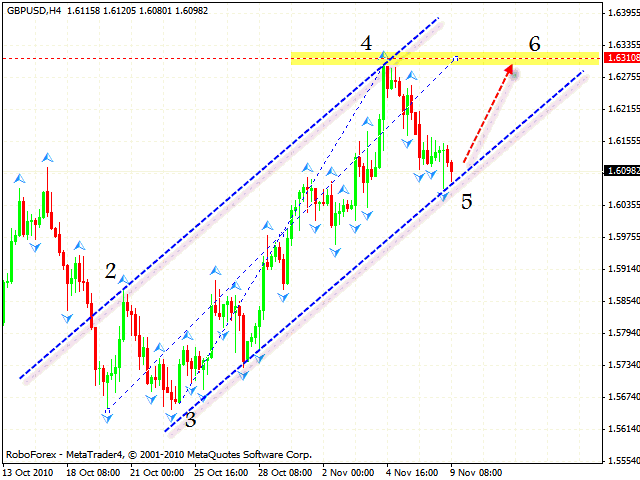
The rising pattern still remains in effect and the price is still moving inside the channel. Judging by gbp usd analysis we should expect it to reach a new local maximum with the target in the area of 1.6310. One can try to buy the pair with the stop below 1.6050.
USD CHF Forecast Nov 10 2010
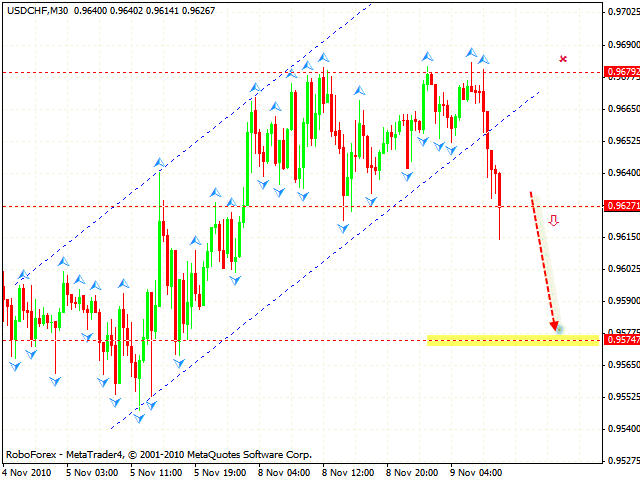
In case of the USD/CHF currency pair we have “double top” pattern forming with the target in the area of 0.9574. According to technical analysis usd chf you can try to sell the pair with the stop above 0.9680. The H4 chart indicates that the price will continue to fall into the area of 0.9430.
Forecasts presented in this section only reflect the author’s private opinion and should not be considered as guidance for trading. RoboForex bears no responsibility for trading results based on trading recommendations described in these analytical reviews.