Bill Williams’ Indicators Analysis 10.04.2013 (USD/CAD, NZD/USD)
10.04.2013
Analysis for April 10th, 2013
USD/CAD
At the H4 chart of the USD/CAD currency pair, the Alligator is sleeping. The price completed a bearish fractal; AO and AC indicators are in the grey zone; there is a Squat bar on the MFI. I opened a buy order with the target above bullish fractals; a protective stop is placed below a bearish one.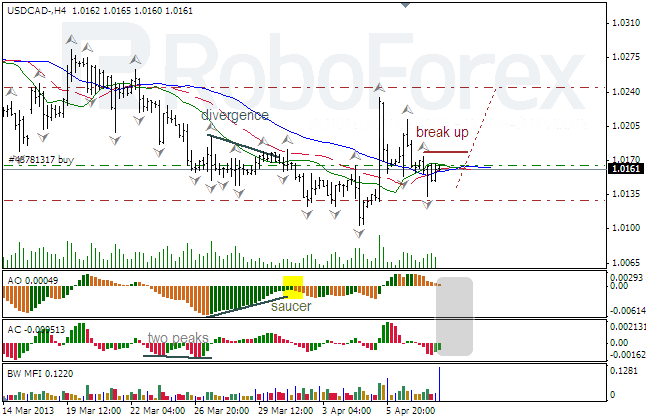
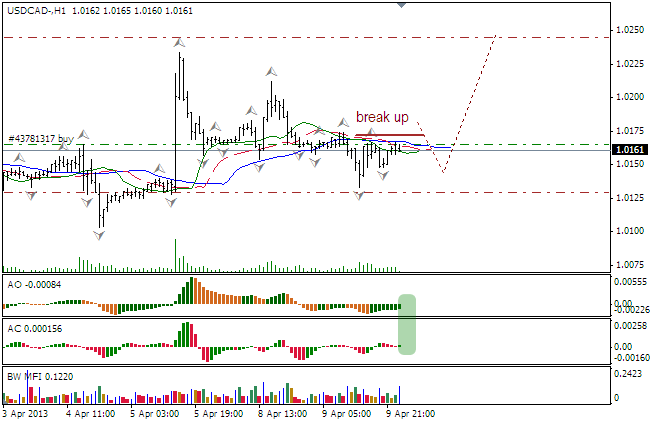
At the H1 chart of the USD/CAD currency pair, the Alligator is also sleeping. The indicators are in the green zone; there might be a Squat bar on the MFI. I opened a buy order with a protective stop below bearish fractals and Take Profit above the highest one.
NZD/USD
At the H4 chart of the NZD/USD currency pair, the Alligator is moving upwards. The price is forming a new bullish fractal, but the indicators are in the grey zone; there might be a Squat bar on the MFI. I opened a sell order.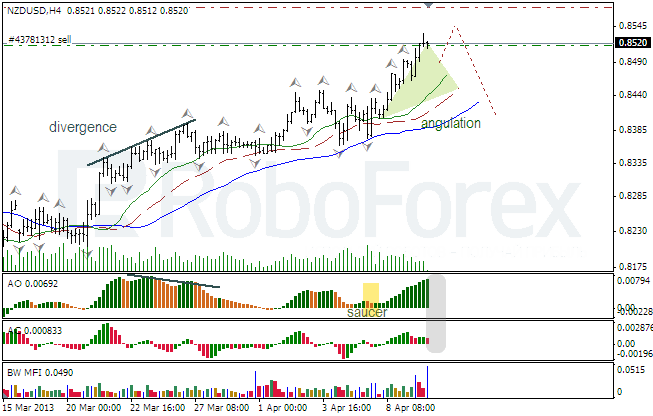
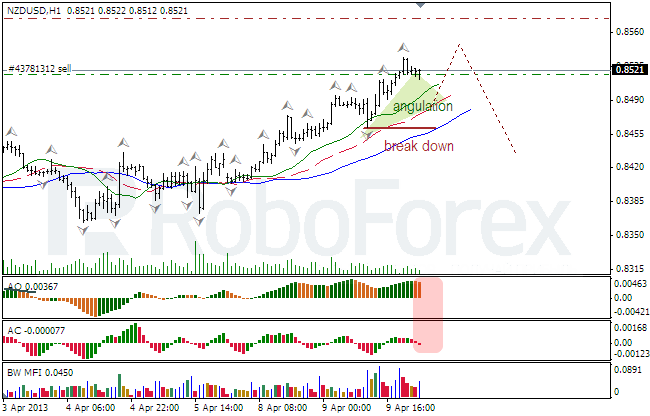
At the H1 chart of the NZD/USD currency pair, the Alligator is also moving upwards. However, the angle of angulation is closing and AO and AC indicators are entering the red zone; there might be a Squat bar on the MFI.
RoboForex Analytical Department
Attention!
Forecasts presented in this section only reflect the author’s private opinion and should not be considered as guidance for trading. RoboForex bears no responsibility for trading results based on trading recommendations described in these analytical reviews.