Bill Williams’ Indicators Analysis 23.05.2013 (USD/CAD, NZD/USD)
23.05.2013
Analysis for May 23rd, 2013
USD/CAD
At the H4 chart of the USD/CAD currency pair, the Alligator is opening its mouth upwards. The angle of angulation is open; there are no Squat bars on the MFI; AO and AC indicators are in the grey zone. I’m staying out of the market until the price forms a bearish fractal.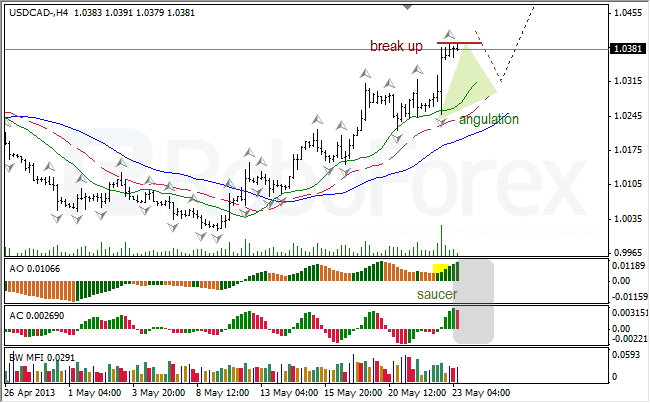
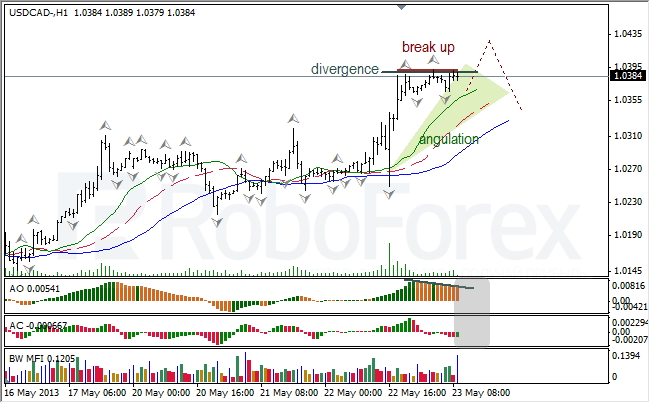
At the H1 chart of the USD/CAD currency pair, the Alligator is going to sleep. There is a divergence with AO; the indicators are in the grey zone; the price is forming fractals, which are equidistant from each other; there is a Fade bar on the MFI. I’m staying out of the market.
NZD/USD
At the H4 chart of the NZD/USD currency pair, the Alligator is opening its mouth downwards. A bearish fractal has been broken; the angle of angulation is open; AO and AC indicators are in the red zone; there are is a Fade bar on the MFI. I I’m keeping my opened a sell order; a protective Stop Loss is above the Alligator’s teeth.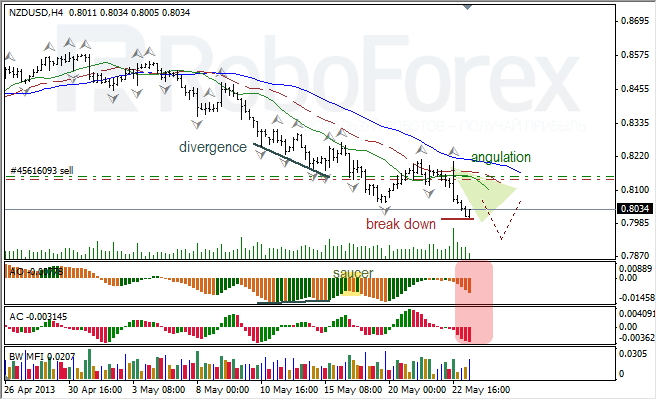
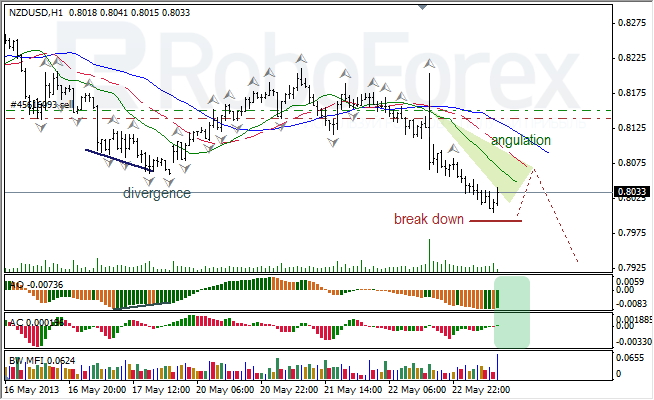
At the H1 chart of the NZD/USD currency pair, the Alligator is moving downwards. The price is forming a new bearish fractal; AO and AC indicators are in the green zone; there might be a Squat bar on the MFI. A protective stop at this timeframe is placed above the Alligator.
RoboForex Analytical Department
Attention!
Forecasts presented in this section only reflect the author’s private opinion and should not be considered as guidance for trading. RoboForex bears no responsibility for trading results based on trading recommendations described in these analytical reviews.