Wave Analysis 07.02.2013 (DJIA Index, Crude Oil)
07.02.2013
Analysis for February 7th, 2013
DJIA Index
The Index continues consolidating; there is a possibility that the price started forming wave [5]. In the near term, the bulls are expected to reach a new local maximum, thus allowing me to move the stop on my buy order into the black.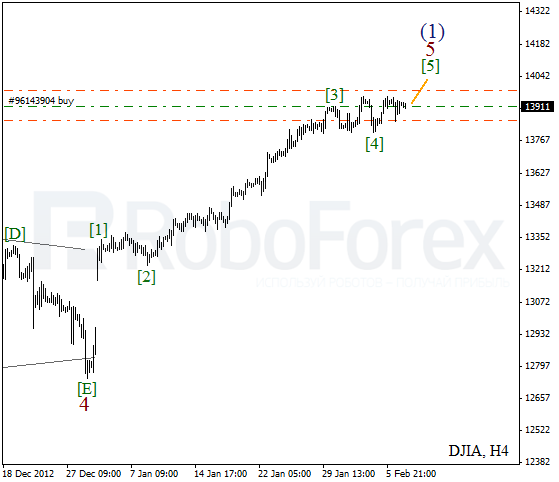
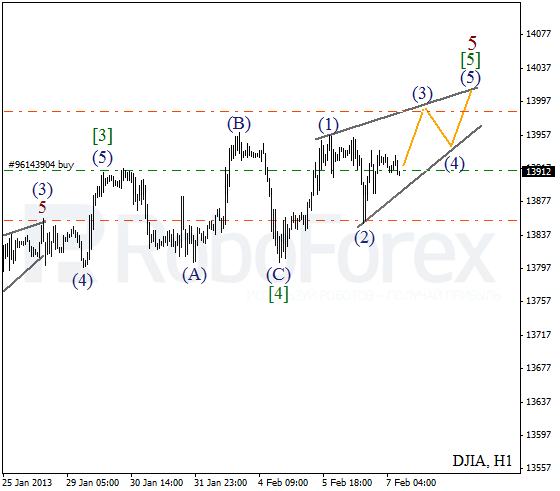
More detailed wave structure is shown on the H1 chart. Wave [4] was completed in the form of flat pattern. Currently the price is forming diagonal triangle pattern inside the fifth wave. Later during the day, the instrument is expected to continue moving upwards inside wave (3) of [5].
Crude Oil
We may assume that an impulse inside wave C has been already completed. On the minor wave level Oil formed an initial descending wave. After a local correction the price may start forming the third bearish wave.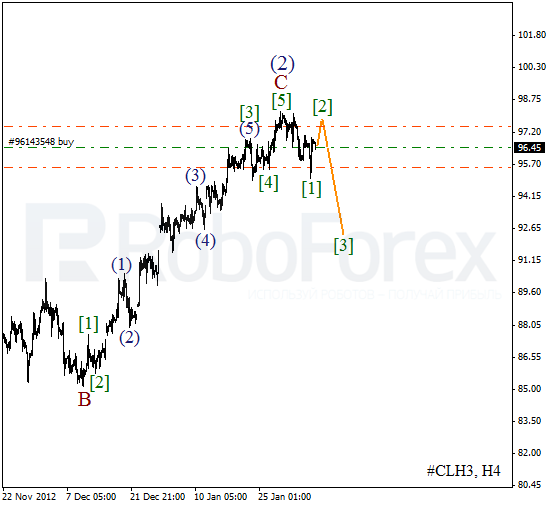
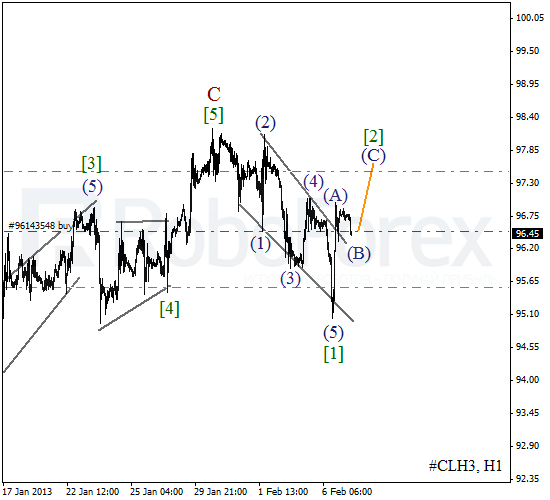
As we can see at the H1 chart, Oil finished a descending wedge pattern inside wave [1]. Right now the market is forming zigzag pattern inside the second wave. Later, in my opinion, the price may start moving downwards again.
RoboForex Analytical Department
Attention!
Forecasts presented in this section only reflect the author’s private opinion and should not be considered as guidance for trading. RoboForex bears no responsibility for trading results based on trading recommendations described in these analytical reviews.