Wave Analysis 08.02.2013 (DJIA Index, Crude Oil)
08.02.2013
Analysis for February 8th, 2013
DJIA Index
It looks like the Index completed the fourth wave; the bulls are trying to start a new ascending movement inside the fifth one. Most likely, in the nearest future the price will break a local maximum and reach the level of 14000.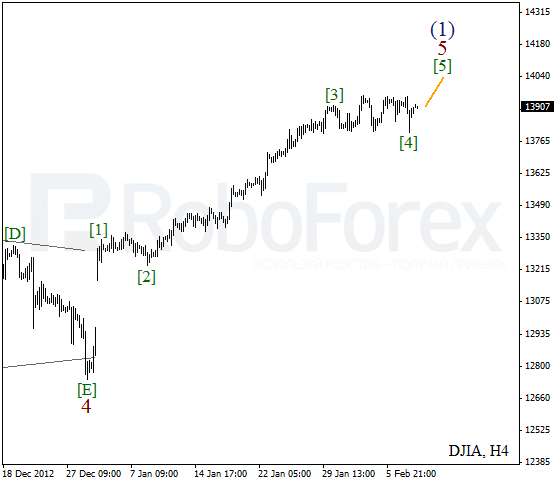
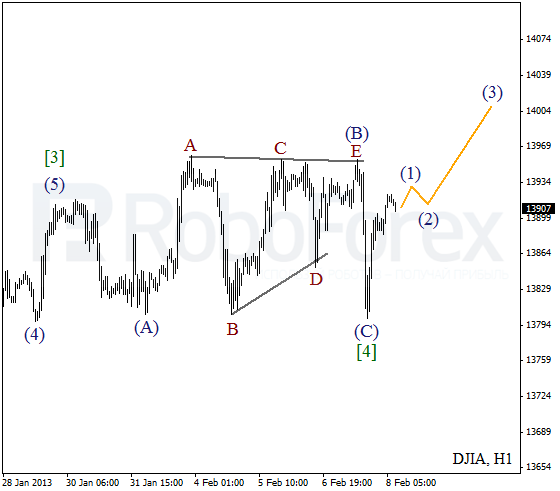
At the H1 chart we can see that wave [4] was completed in the form of zigzag pattern. On the minor wave level the price formed diagonal triangle pattern inside wave (B). Later, the instrument is expected to start a correction and then start moving upwards inside wave (3) of [5].
Crude Oil
We may assume that wave C has been completed. On the minor wave level Oil formed an initial impulse inside wave [1]. Most likely, in the nearest future the price will continue moving downwards and break a local minimum.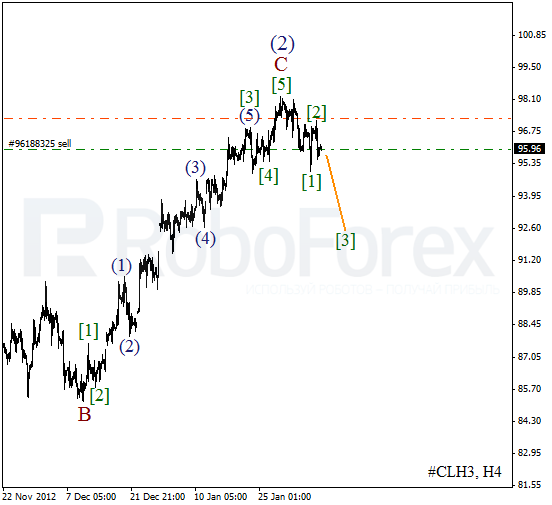
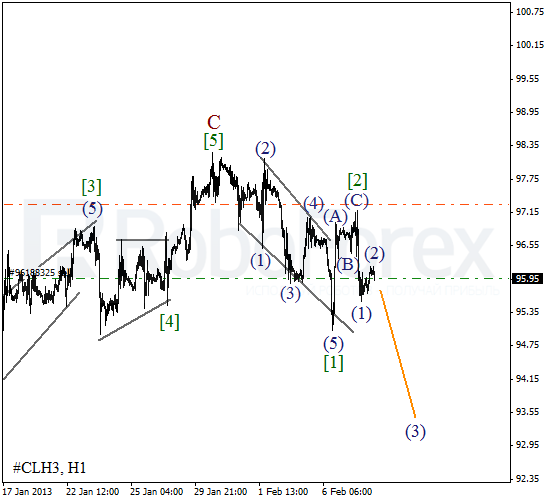
As we can see at the H1 chart, Oil finished wedge pattern inside the first wave. Wave [2] also has been already completed and right now the bears are trying to start a new descending movement inside the third one. The target for the next several hours is the level of $99 per barrel of Light Sweet.
RoboForex Analytical Department
Attention!
Forecasts presented in this section only reflect the author’s private opinion and should not be considered as guidance for trading. RoboForex bears no responsibility for trading results based on trading recommendations described in these analytical reviews.