Wave Analysis 15.02.2012 (NZD/USD, EUR/USD)
15.02.2012
Analysis for February 15th, 2012
NZD/USD
It looks like wave [5] of C is taking the form of diagonal triangle pattern. The rising price movement is slowing down, and the bulls just aren’t strong enough to continue pushing the market upwards. Most likely, the pair will reach a new local maximum, but won’t move any farther.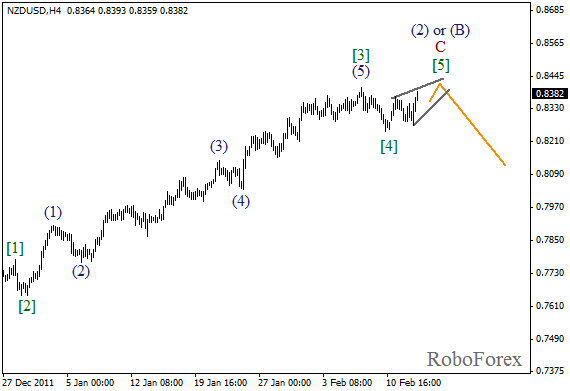
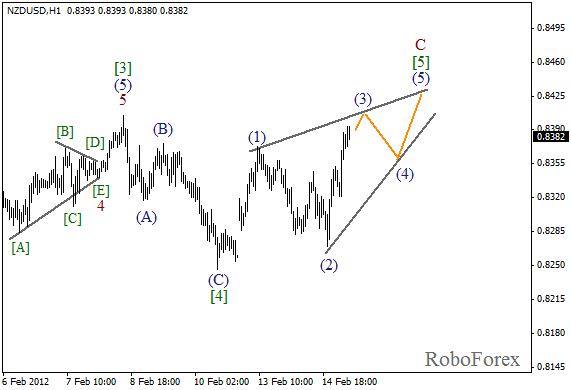
More detailed wave structure is shown on the H1 chart. It looks like the price is forming diagonal triangle pattern with the third wave being completed inside it. We can expect the pair to stop growing up in wave C on Wednesday or Thursday.
EUR/USD
At the H4 chart the price formed an initial wedge pattern in a downward direction. We may assume that wave [2] has been finally completed. On Wednesday we can expect the correction to take place, however, after that Euro may start falling down in wave 3.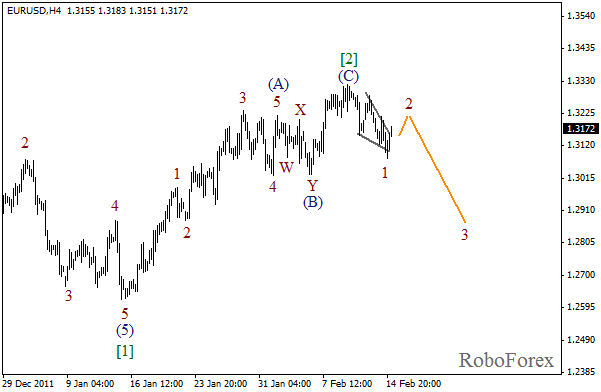
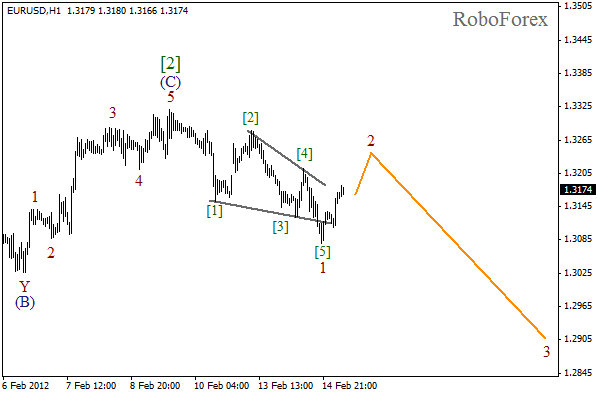
More detailed wave structure is shown on the H1 chart. The descending price movement over the last several days looks much alike an initial wedge pattern. Most likely, Euro will start falling down again, much lower than the previous bearish wave.
Attention!
Forecasts presented in this section only reflect the author’s private opinion and should not be considered as guidance for trading. RoboForex bears no responsibility for trading results based on trading recommendations described in these analytical reviews.