Wave Analysis 25.04.2014 (DJIA Index, Crude Oil)
25.04.2014
Analysis for April 25th, 2014
DJIA Index
Chart structure has been changed. It looks like Index formed bullish impulse inside wave (1) and then started correction. In the near term, price is expected to finish the second wave and start growing up inside the third one.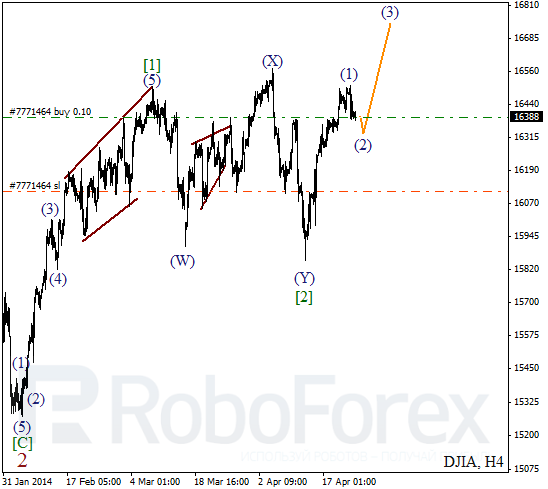
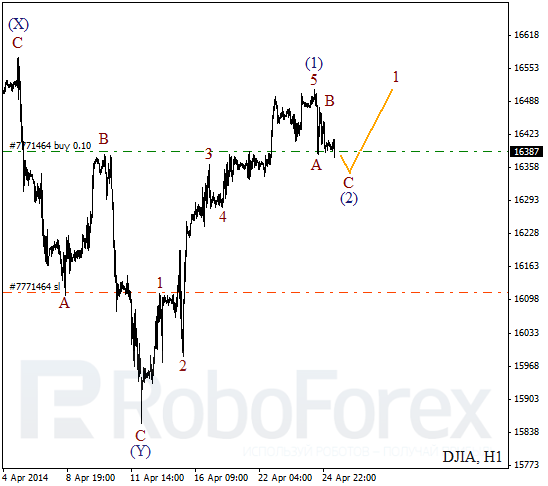
More detailed wave structure is shown on H1 chart. Probably, wave (2) is taking the form of zigzag pattern with wave C being completed inside it. Possibly, market may start forming initial bullish impulse during the day.
Crude Oil
Current chart structure implies that Oil may continue falling down inside the third wave. Earlier price formed bearish impulse inside wave 1. Market may break minimum of this wave in the beginning of the next week.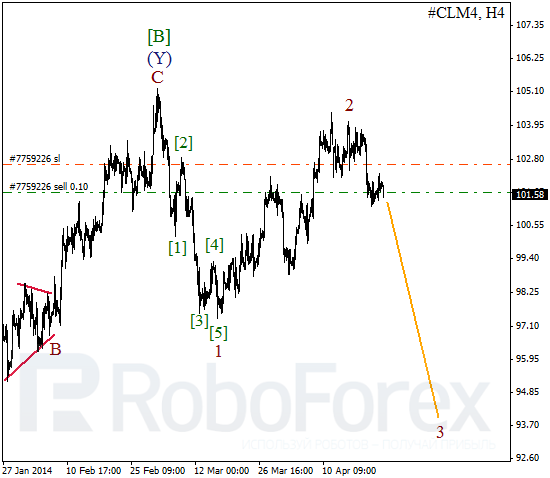
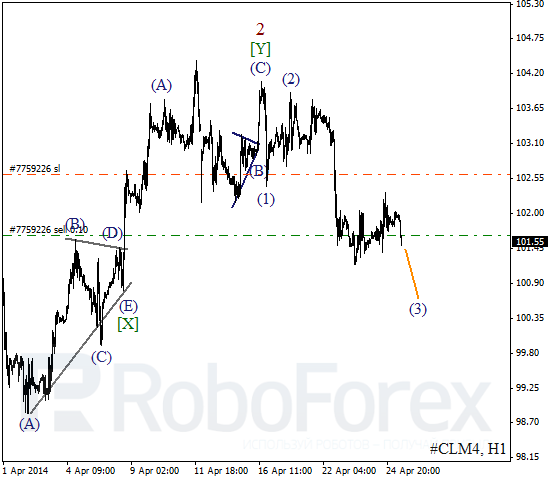
As we can see at the H1 chart, instrument is forming extension inside the third wave. Yesterday I opened sell order during correction. I’ll move stop into the black as soon as bears break minimum.
RoboForex Analytical Department
Attention!
Forecasts presented in this section only reflect the author’s private opinion and should not be considered as guidance for trading. RoboForex bears no responsibility for trading results based on trading recommendations described in these analytical reviews.