Wave Analysis 04.06.2013 (DJIA Index, Crude Oil)
04.06.2013
Analysis for June 4th, 2013
DJIA Index
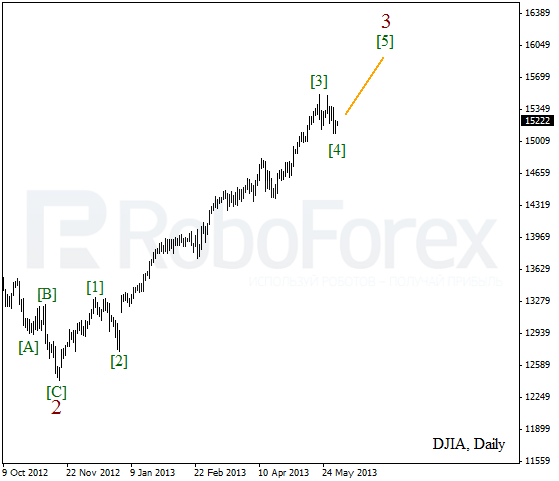
At shorter timeframes, the price movement over the last several days looks less and less like a reverse; that’s why it’s quite logical to expect the Index to continue growing up. We can’t exclude a possibility that at the weekly chart the price is extending the third wave with wave 3 inside it.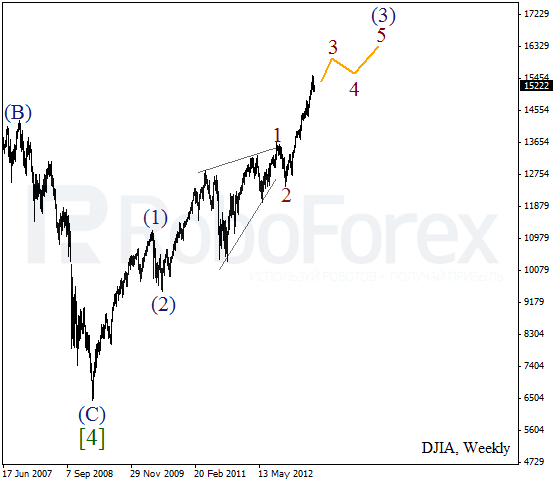
More detailed wave structure is shown on the H1 chart. It looks like the price is finishing the fourth wave inside wave 3. At the same time, a local correction may yet continue for a while and take the form of, for example, horizontal triangle pattern. Most likely, during the next several days the instrument will start growing up inside the fifth wave.
Crude Oil
We may assume that Oil completed the second wave. Earlier the price formed wedge pattern inside wave 1. On the minor wave level, during the next several days the price may continue forming an initial impulse inside wave [1].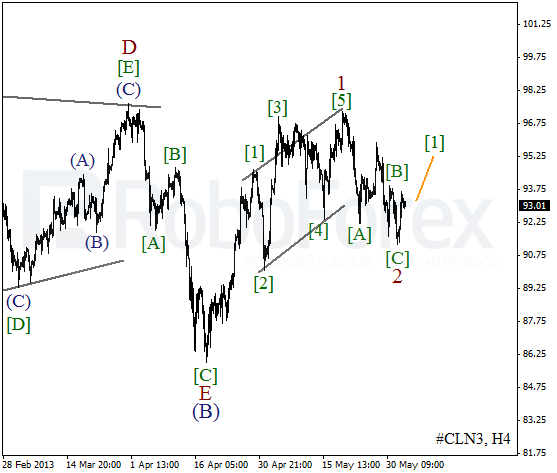
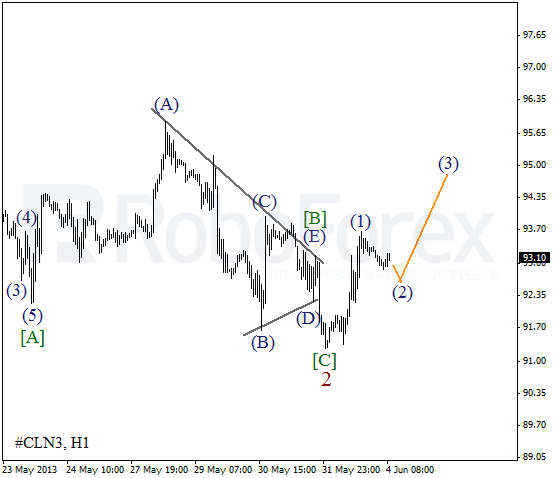
As we can see at the H1 chart, wave 2 was completed in the form of zigzag pattern with triangle inside wave [B]. Earlier Oil formed a bullish impulse inside wave (1). After a local correction, the price may start growing up inside the third wave.
RoboForex Analytical Department
Attention!
Forecasts presented in this section only reflect the author’s private opinion and should not be considered as guidance for trading. RoboForex bears no responsibility for trading results based on trading recommendations described in these analytical reviews.