Wave Analysis 11.07.2012 (NZD/USD, EUR/USD)
11.07.2012
Analysis for July 11th, 2012
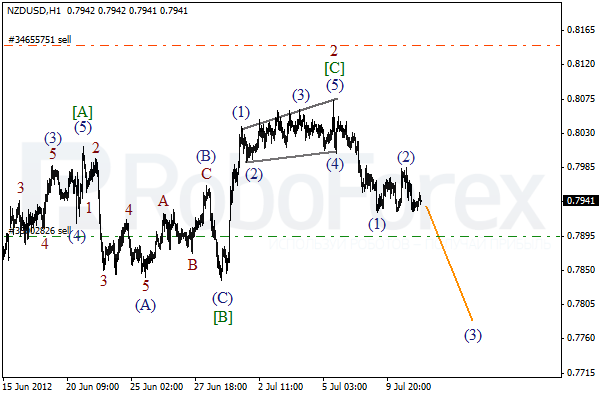
NZD/USD
It looks like the price, after finishing zigzag pattern in wave 2, is forming an initial descending impulse. The current chart structure indicates that New Zealand Dollar may continue falling down. There is a possibility that the price may break the minimum of wave [B] in the nearest future.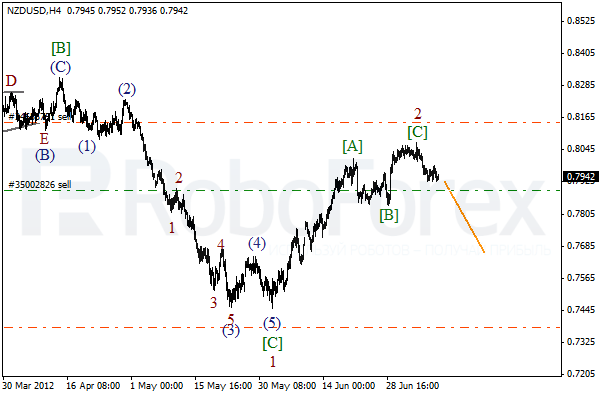
Wave [C] of 2 has taken the form of divergent diagonal triangle pattern. On the minor wave level the price has formed an initial impulse in wave (1). We may assume that the local correction has been completed, that’s why the price is expected to start moving downwards again in wave (3) during the day.
EUR/USD
The price continues falling down inside wave 3. Euro has been able to stay below the minimum of wave (3). Most likely, the price will continue falling down in the nearest future. The target is still at the level of 1.2000.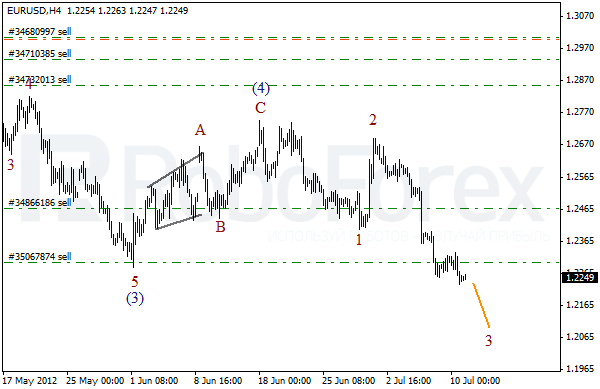
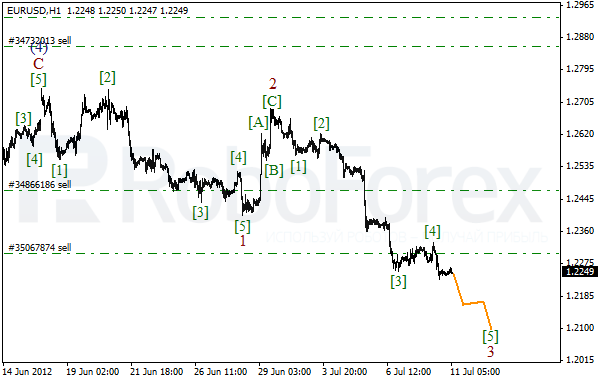
If we take a look at more detailed wave structure, which is shown on the H1 chart, we can see that at the moment Euro is falling down inside wave [5] of 3. Earlier the price formed an extension in wave [3]. It looks like the bears are going to continue pushing the market downwards during the day.
Attention!
Forecasts presented in this section only reflect the author’s private opinion and should not be considered as guidance for trading. RoboForex bears no responsibility for trading results based on trading recommendations described in these analytical reviews.