Wave Analysis 25.07.2013 (DJIA Index, Crude Oil)
25.07.2013
Analysis for July 25th, 2013
DJIA Index
It looks like the Index finished an extension inside the third wave; the bulls reached a new historic maximum. The price started forming wave (4) and may consolidate for the next several days.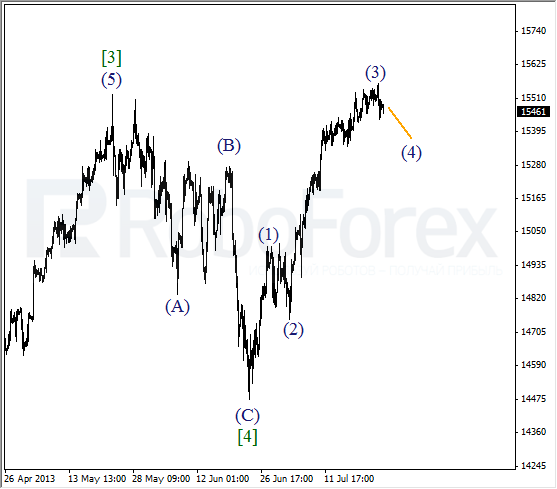
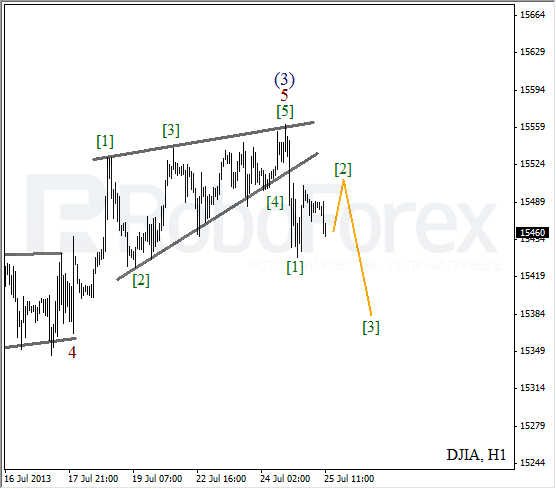
At the H1 chart we can see, that after finishing diagonal triangle pattern inside wave 5, the price started a correction. On the minor wave level, the instrument formed an initial bearish impulse. After a slight correction, the instrument may start falling down inside wave [3].
Crude Oil
Oil is also being corrected. We may assume that the price is about to finish the fourth wave. In this case, there is a possibility that the price may start a new ascending movement inside the fifth wave and break the previous maximum.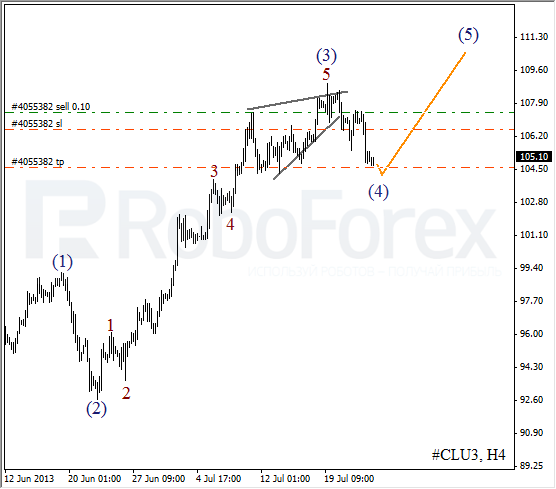
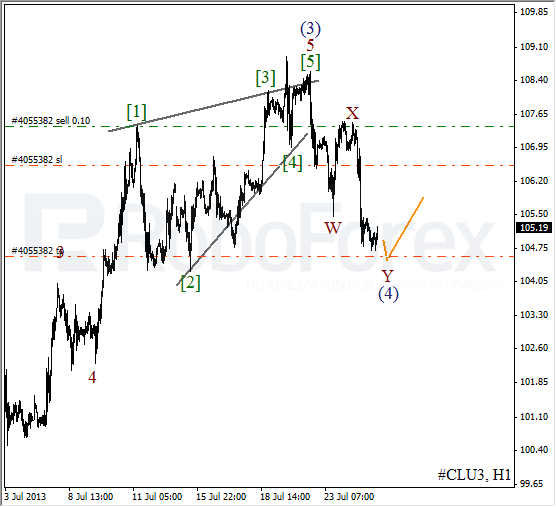
More detailed wave structure is shown on the H1 chart. One of the possible scenarios implies that the correction was completed in the form of double zigzag pattern. In this case, the instrument is expected to make a final descending movement and then start forming the first ascending wave.
RoboForex Analytical Department
Attention!
Forecasts presented in this section only reflect the author’s private opinion and should not be considered as guidance for trading. RoboForex bears no responsibility for trading results based on trading recommendations described in these analytical reviews.