Wave Analysis 13.09.2013 (DJIA Index, Crude Oil)
13.09.2013
Analysis for September 13th, 2013
DJIA Index
The current chart structure chart implies that the Index completed an ascending zigzag pattern inside wave [B]. In the future, the instrument is expected to form an initial impulse inside wave (1). Right now, I’m staying out of the market and planning to open sell orders only after the price makes a reverse and starts falling down inside wave [C].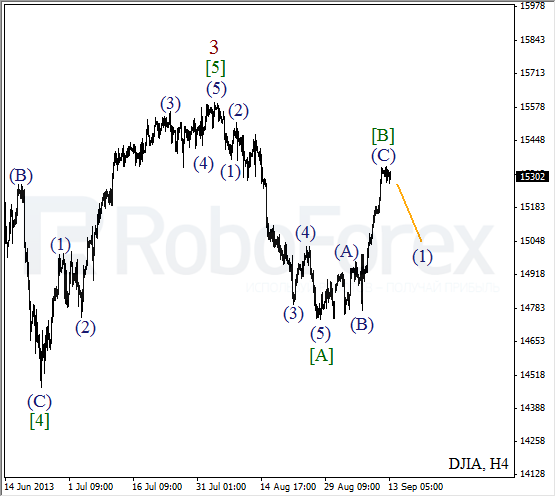
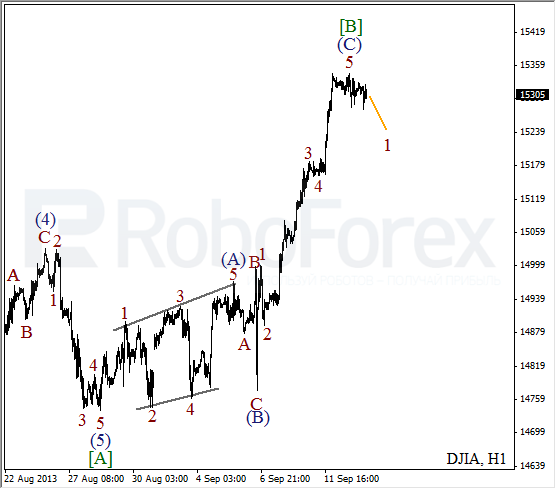
More detailed wave structure is shown on the H1 chart. It looks like the price finished an impulse inside wave (C). We can’t exclude a possibility that the Index has already formed several short descending impulses and during the next several hours may continue forming wave 1.
Crude Oil
We may assume that the market continues forming diagonal triangle pattern inside wave (5). On the minor wave level, the price is forming the third wave. There is a possibility that Oil may break the maximum during the next several days.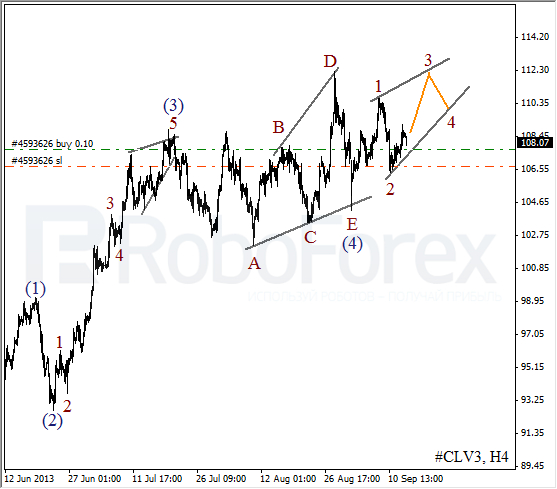
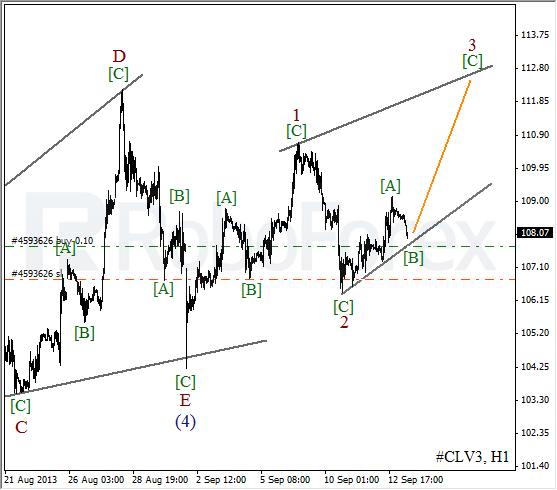
As we can see at the H1 chart, the price formed zigzag pattern inside wave 2. On the minor wave level, the instrument completed a bullish impulse inside wave [A]. After completing a local correction, the price may start growing up inside wave [C] of 3.
RoboForex Analytical Department
Attention!
Forecasts presented in this section only reflect the author’s private opinion and should not be considered as guidance for trading. RoboForex bears no responsibility for trading results based on trading recommendations described in these analytical reviews.