Wave Analysis 03.10.2012 (DJIA Index, Crude Oil)
03.10.2012
Analysis for October 3rd, 2012
DJIA Index
It looks like the Index is still forming diagonal triangle pattern inside wave (5) of [1]. The market is again testing the pattern’s lower border. If the price rebounds from the current levels, the instrument will start moving upwards and break a local maximum.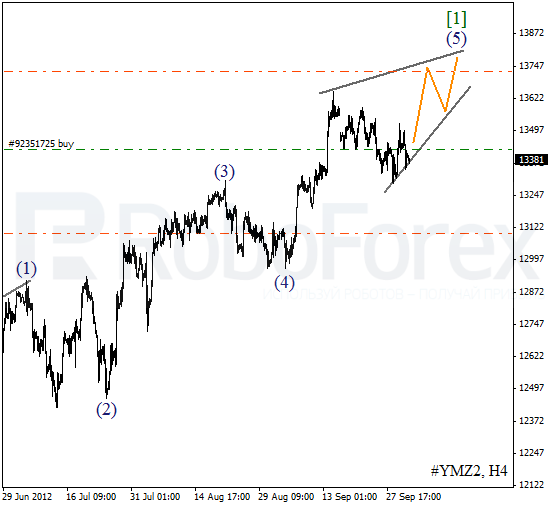
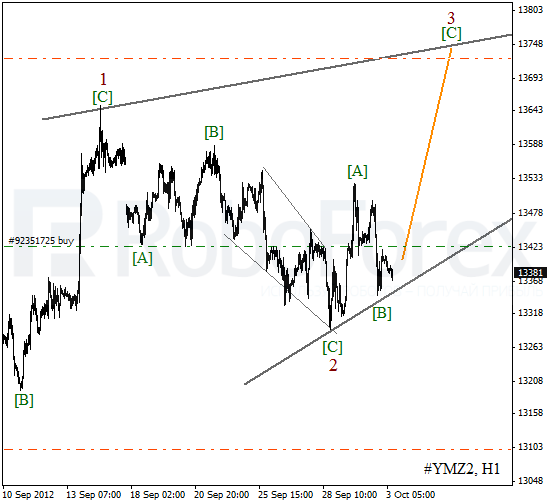
As we can see at the H1 chart, wave 2 has been completed with diagonal triangle pattern inside wave [C]. The price has formed an ascending impulse inside wave [A]. In the near term, the instrument is expected to start growing up and form wave [3] of 3.
Crude Oil
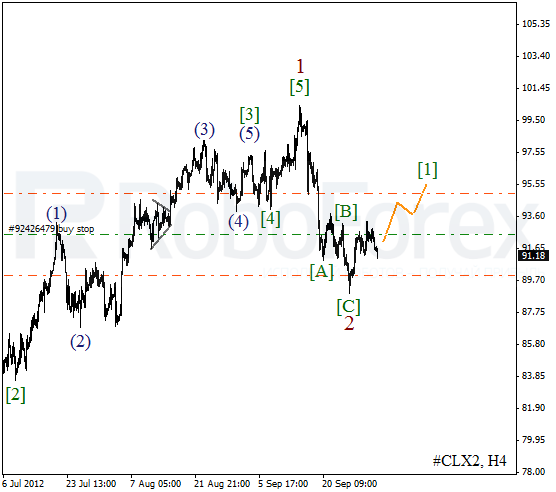
Right now the bulls aren’t strong enough to make the price move upwards. We may assume that at the moment Oil is forming an initial impulse inside wave [1]. My stop that was moved into the black worked yesterday, so I’ve opened one more buy order.
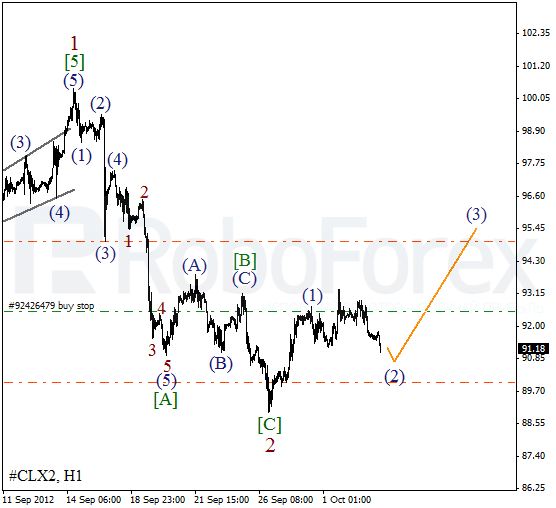
More detailed wave structure is shown on the H1 chart. Wave 2 is taking the form of flat pattern and may be completed very soon. Earlier Oil formed an ascending impulse inside wave (1). During the day the instrument is expected to start moving upwards and form wave (3) of [1].
RoboForex Analytical Department
Attention!
Forecasts presented in this section only reflect the author’s private opinion and should not be considered as guidance for trading. RoboForex bears no responsibility for trading results based on trading recommendations described in these analytical reviews.