Wave Analysis 21.10.2013 (DJIA Index, Crude Oil)
21.10.2013
Analysis for October 21st, 2013
DJIA Index
We may assume that the Index is finishing wave B in the form of zigzag pattern. On the minor wave level, the price is completing diagonal triangle pattern inside wave [C]. We can’t exclude a possibility that in the nearest future the instrument may reverse.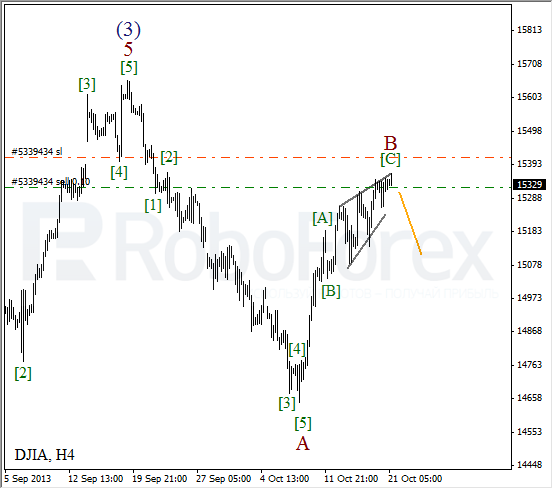
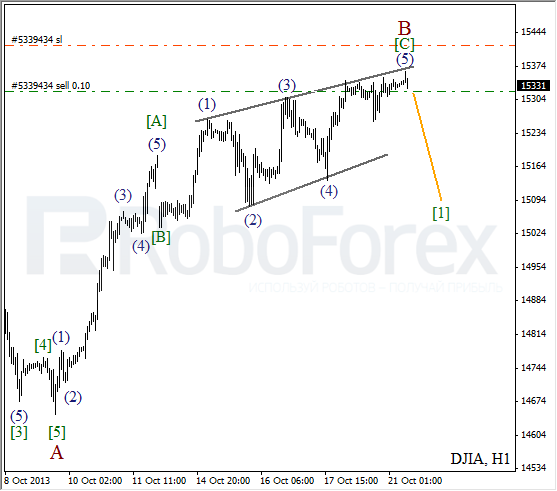
More detailed wave structure is shown on the H1 chart. The price is finishing the fifth wave inside diagonal triangle pattern. The market rebounded from the pattern’s upper border and may start moving downwards.
Crude Oil
It looks like wave (4) is taking the form of double three pattern. There is a possibility that the price may yet break the minimum. However, later the instrument may start growing up while forming an initial ascending impulse.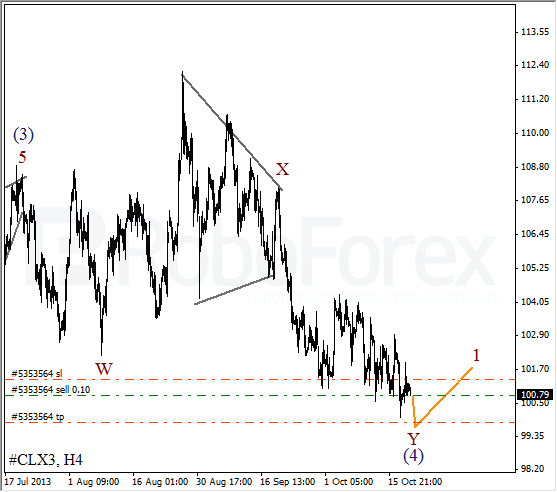
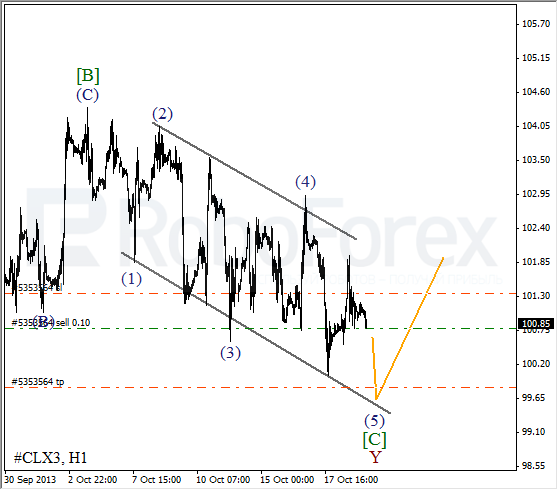
As we can see at the H1 chart, Oil is forming diagonal triangle pattern inside wave [C]. The price is expected to continue falling down inside wave (5) during the day. I opened a short-term sell order.
RoboForex Analytical Department
Attention!
Forecasts presented in this section only reflect the author’s private opinion and should not be considered as guidance for trading. RoboForex bears no responsibility for trading results based on trading recommendations described in these analytical reviews.