Wave Analysis 25.10.2013 (DJIA Index, Crude Oil)
25.10.2013
Analysis for October 25th, 2013
DJIA Index
It looks like the Index is finishing an ascending zigzag pattern inside wave B. On the minor wave level, the price is completing diagonal triangle pattern inside wave [C]. In the near term, the instrument is expected to start a new descending movement inside wave [1].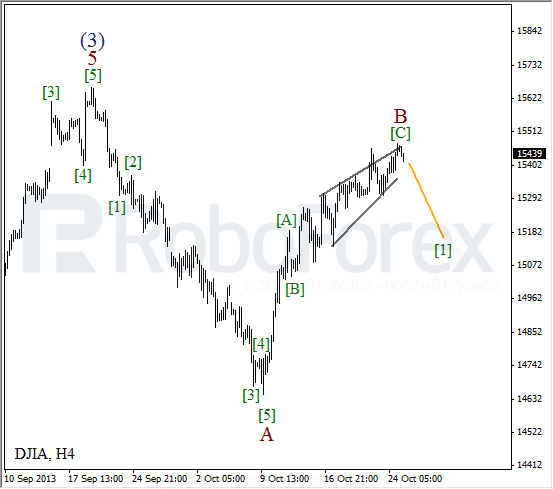
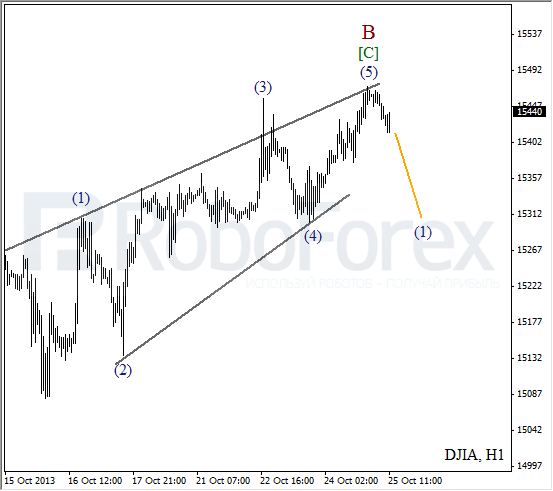
As we can see at the H1 chart, yesterday the price formed wave (5) inside diagonal triangle pattern. We may assume that right now the Index is forming an initial descending impulse. The instrument may continue falling down during the day.
Crude Oil
Oil continues forming a bearish impulse. Most likely, in the nearest future the market will break the minimum again. Later, the instrument may start a new correction.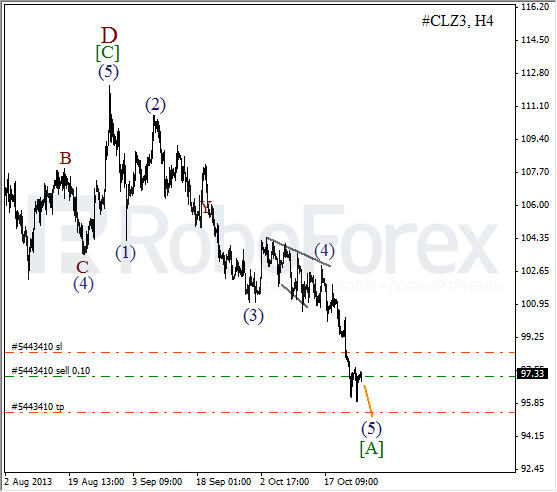
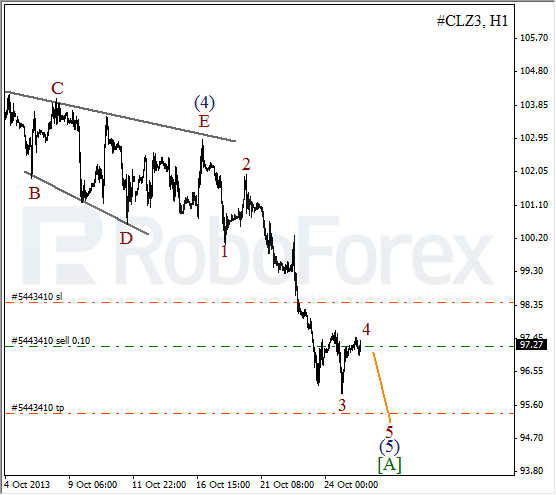
More detailed wave structure is shown on the H1 chart. It looks like the instrument is finishing the fourth wave inside wave (5). Later, the price is expected to finish a local correction and start falling down inside wave 5 of (5).
RoboForex Analytical Department
Attention!
Forecasts presented in this section only reflect the author’s private opinion and should not be considered as guidance for trading. RoboForex bears no responsibility for trading results based on trading recommendations described in these analytical reviews.