Wave Analysis 02.11.2011 (USD/CHF, EUR/USD)
02.11.2011
Analysis for November 2nd, 2011
USD/CHF
We may assume that after completing zigzag pattern in wave (B) the price has formed an initial rising impulse in wave 1. Currently we can see the formation of the second wave. Most likely, the local correction will be finished in the nearest future and we can expect the start of wave 3.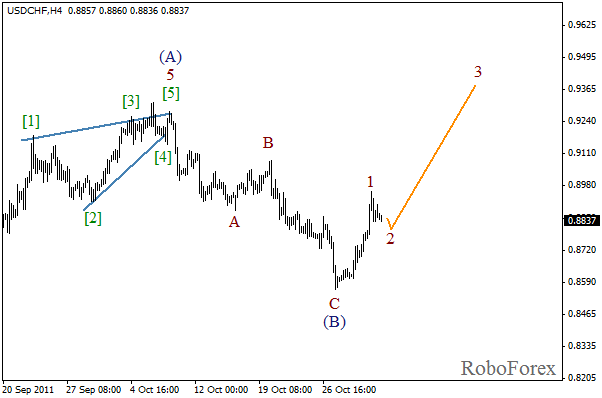
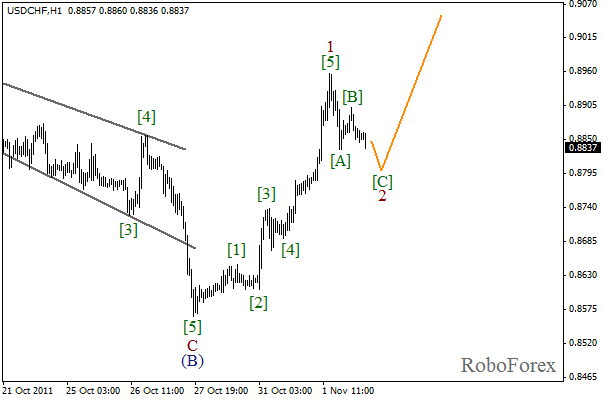
More detailed wave markings are shown on the H1 chart. Wave [5] of 1 is the largest one inside this impulse. At the moment the price is forming wave [C] of 2. The second wave may be finished within the next several hours.
EUR/USD
It looks like the price, after completing diagonal triangle pattern in wave [C] of X, is forming a descending impulse in wave A. On the minor wave level the correction is taking place. Most likely, the price will start falling down again in the nearest future.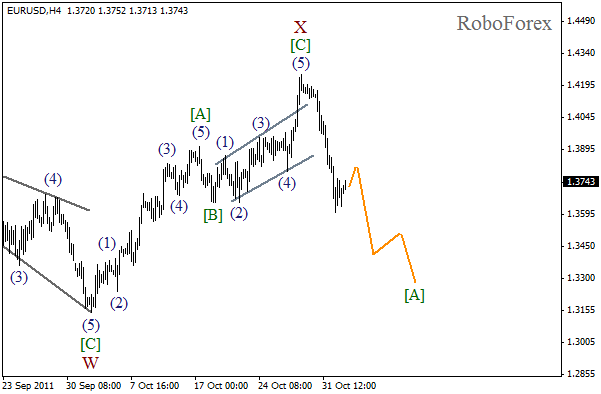
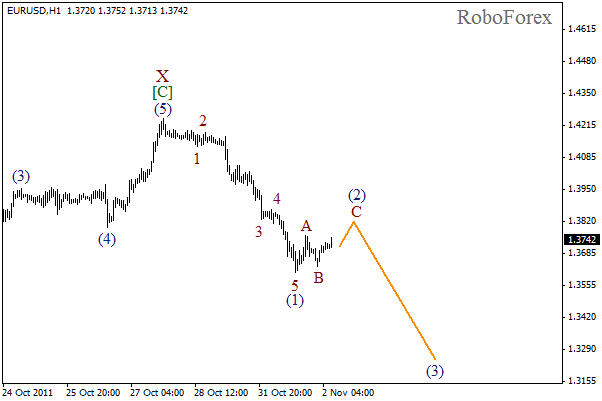
As we can see at the H1 chart, impulse wave (1) has been completed with extended wave 3 inside it. Currently the price is completing zigzag pattern in the second wave, with wave C being formed inside the same wave. During the day we can expect the local correction to be finished and the price to start falling down while forming wave (3).
Attention!
Forecasts presented in this section only reflect the author’s private opinion and should not be considered as guidance for trading. RoboForex bears no responsibility for trading results based on trading recommendations described in these analytical reviews.