Wave Analysis 03.11.2011 (USD/CHF, EUR/USD)
03.11.2011
Analysis for November 3rd, 2011
USD/CHF
We may assume that the price, after finishing zigzag pattern in wave (B), has completed an initial rising impulse. It looks like the second wave has also been formed. The current chart structure lets us suppose that the price will continue growing during the next several days while forming the third wave.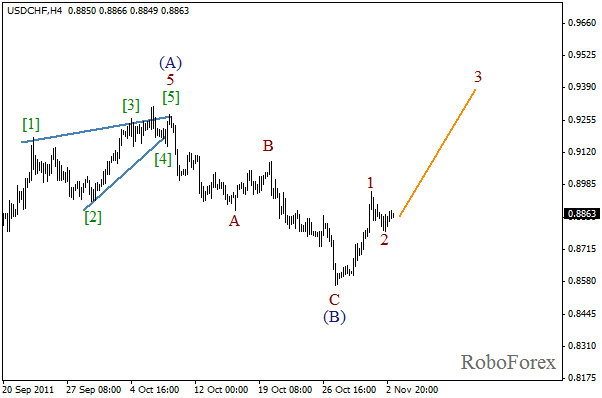
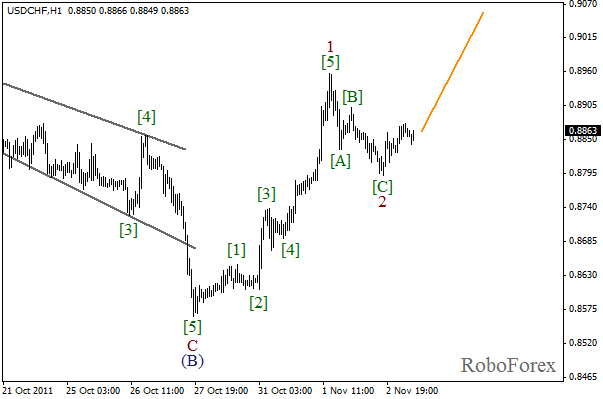
As we can see on more detailed wave markings, which are shown on the H1 chart, wave 2 has been completed in the form of zigzag pattern. Currently the price is forming initial waves inside the third one. During the day we can expect the price to reach a new maximum.
EUR/USD
At the H4 chart we can see that the market has completed zigzag pattern in wave X, and now is forming a descending impulse in wave [A]. The forecast of the price movement is shown on the chart. During the day the price may start falling down again and reach a new local minimum.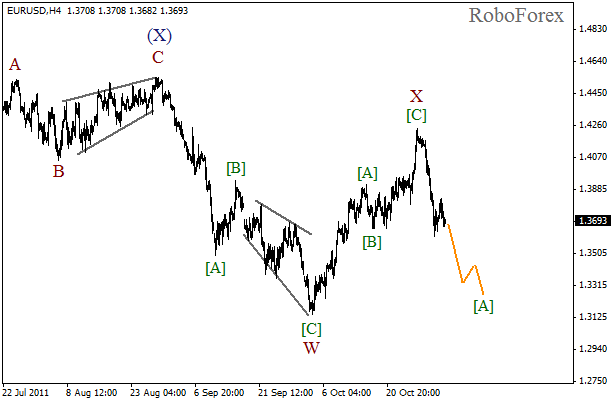
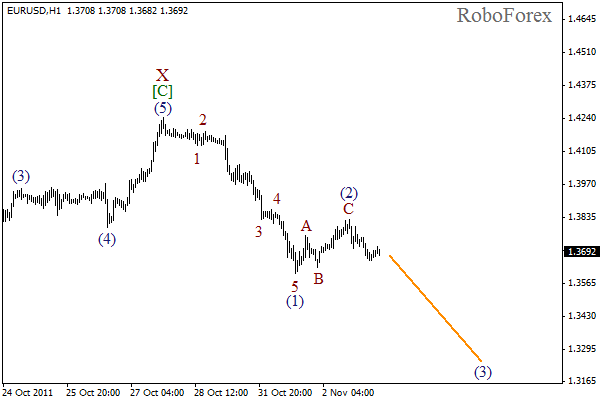
After completing a descending bearish initial impulse in wave (1), the price has formed a rising zigzag pattern inside the second wave. Now the market is starting to move downwards and may reach the level of 1.3300 while forming the third wave.
Attention!
Forecasts presented in this section only reflect the author’s private opinion and should not be considered as guidance for trading. RoboForex bears no responsibility for trading results based on trading recommendations described in these analytical reviews.