Wave Analysis 13.11.2012 (DJIA Index, Crude Oil)
13.11.2012
Analysis for November 13th, 2012
DJIA Index
Today I’ve decided to take a look at the longer time frames. We can’t exclude a possibility that right now the Index is starting to form wave (2), which may continue up to the next year. In case Democrats and Republicans don’t come to an agreement, this scenario may come true and “financial black hole”, which now is only hypothetical, may come into reality.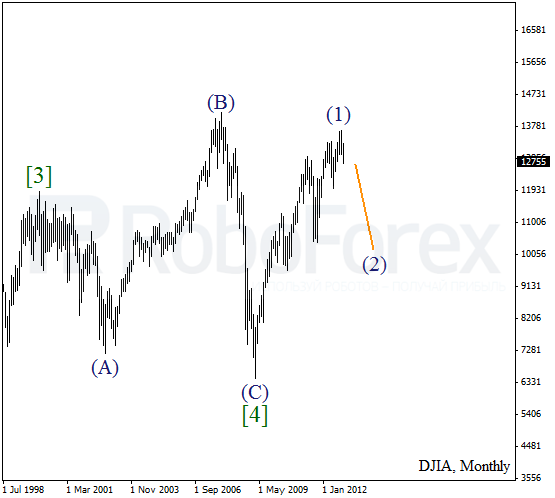
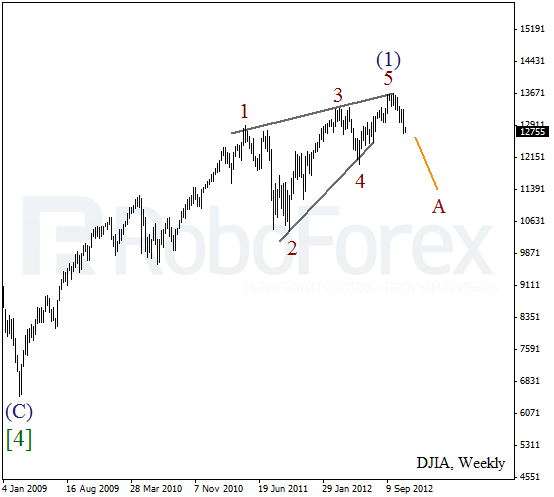
As we can see at the weekly chart, wave (1) was completed in the form of wedge pattern. On the minor wave level the Index is forming a descending wave A. Most likely, the price to will continue moving downwards during the next several weeks.
Crude Oil
One of the possible scenarios implies that wave [B] was completed in the form of horizontal triangle pattern. We can’t exclude a possibility that right now the price is forming first descending waves inside wave [C]. In the future, we can expect Oil to break a local minimum.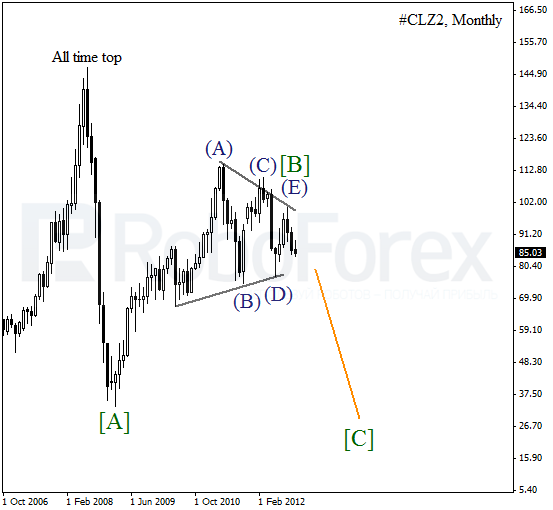
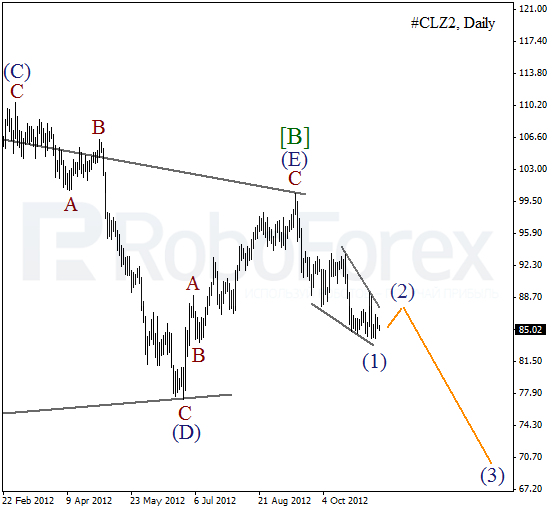
After completing triangle pattern inside wave [B], the price then formed a descending wedge pattern inside wave (1) on the minor wave level. Oil may be corrected for a while inside the second wave, however, later we can expect it to start moving downwards inside the third one.
RoboForex Analytical Department
Attention!
Forecasts presented in this section only reflect the author’s private opinion and should not be considered as guidance for trading. RoboForex bears no responsibility for trading results based on trading recommendations described in these analytical reviews.