Wave Analysis 14.11.2012 (DJIA Index, Crude Oil)
14.11.2012
Analysis for November 14th, 2012
DJIA Index
Yesterday I reviewed a longer time frame with bearish scenario. After completing an initial wedge pattern inside wave [1], the Index started a local correction. We can’t exclude a possibility that the price may form flat pattern during the next several days, but later the instrument is expected to continue moving downwards.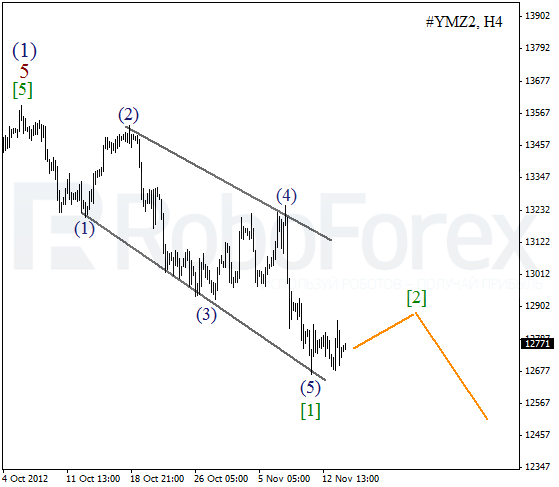
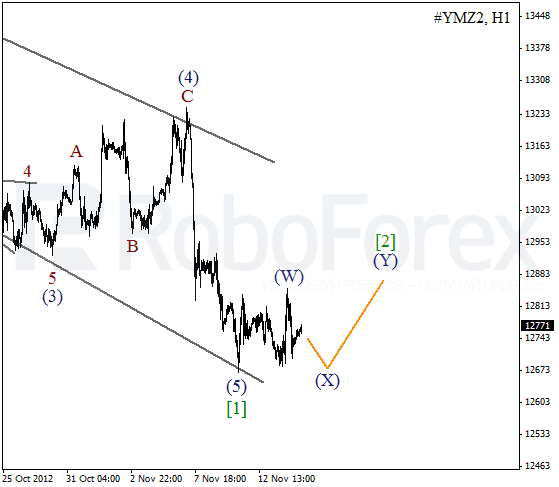
As we can see at the H1 chart, the second wave may take the form of zigzag pattern. The Index formed only three ascending waves so far, and they are not enough. Most likely, the price to will move inside a narrow trading range during the next several days.
Crude Oil
Yesterday I discussed one of the possible scenarios, which implies that the price may start a significant descending movement. At the H4 chart we can see that Oil formed a descending wedge pattern. The instrument is expected to continue falling down after a local correction.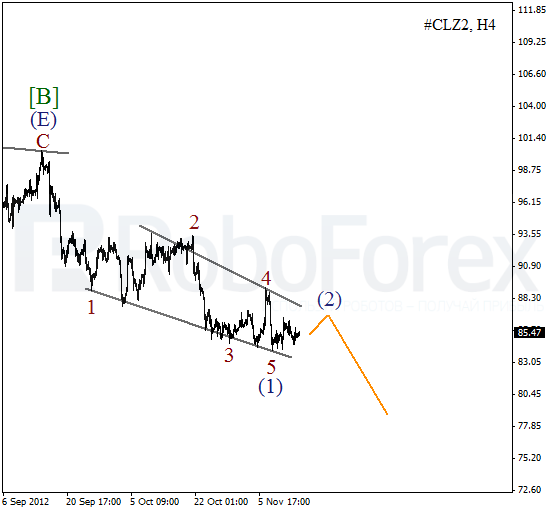
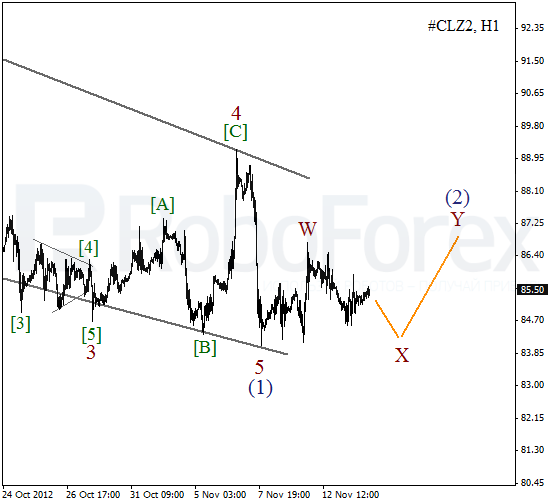
After rebounding from the lower border of wedge pattern, the price started a corrective movement. It looks like wave (2) is taking the form of double zigzag pattern. In the near term, Oil is expected to form flat pattern, which may be broken by the bears within the next several days.
RoboForex Analytical Department
Attention!
Forecasts presented in this section only reflect the author’s private opinion and should not be considered as guidance for trading. RoboForex bears no responsibility for trading results based on trading recommendations described in these analytical reviews.