Wave Analysis 21.11.2012 (DJIA Index, Crude Oil)
21.11.2012
Analysis for November 21st, 2012
DJIA Index
It looks like the Index is finally completing wave (2). Earlier the price formed a bearish wedge pattern inside the first wave. We can’t exclude a possibility that one of these days the instrument may start falling down and forming wave (3).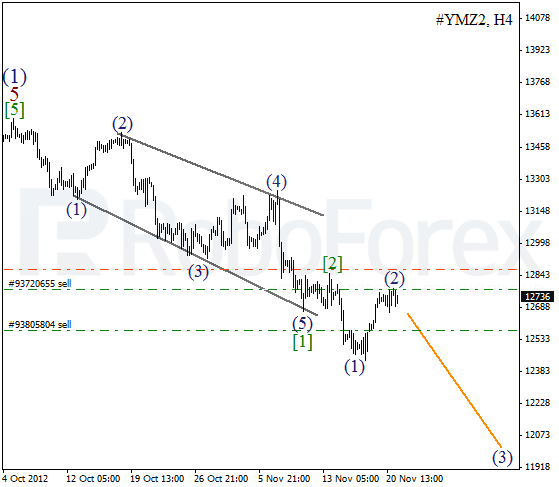
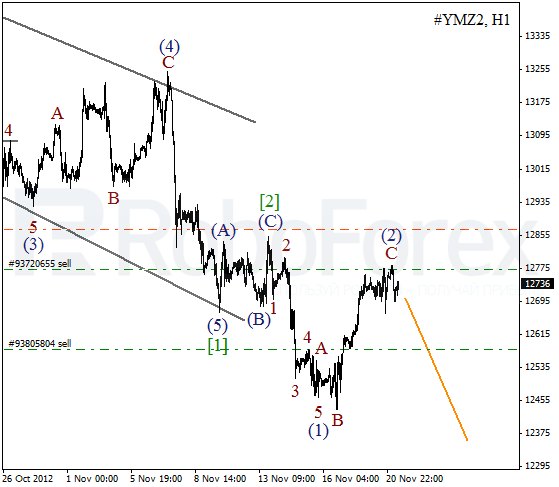
As we can see at the H1 chart, wave (2) took the form of flat pattern. On the minor wave level the Index completed an impulse inside wave C. Most likely, price will to start a new descending movement on Wednesday.
Crude Oil
We may assume that yesterday Oil finished wave (2). Earlier the price completed an initial descending impulse inside wave (1). In the future the price is expected to start falling down and form the third wave. The instrument may break a local minimum within the next several days.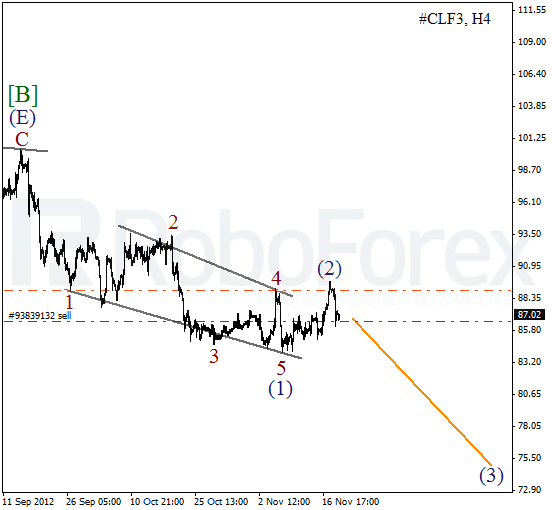
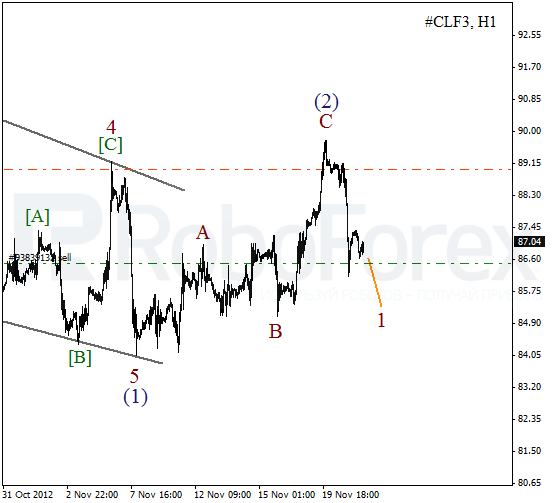
The current chart structure implies that the price may have already completed wave (2) in the form of zigzag pattern. On the minor wave level the instrument is forming an initial bearish impulse. In the near term, Oil is expected to continue moving downwards.
RoboForex Analytical Department
Attention!
Forecasts presented in this section only reflect the author’s private opinion and should not be considered as guidance for trading. RoboForex bears no responsibility for trading results based on trading recommendations described in these analytical reviews.