Wave Analysis 26.11.2013 (DJIA Index, Crude Oil)
26.11.2013
Analysis for November 26th, 2013
DJIA Index
Internal structure of wave 1 implies that this wave is completed and Index started new correction. Possibly, during the next several days price may form initial bearish impulse and wave to start new descending movement inside wave 2.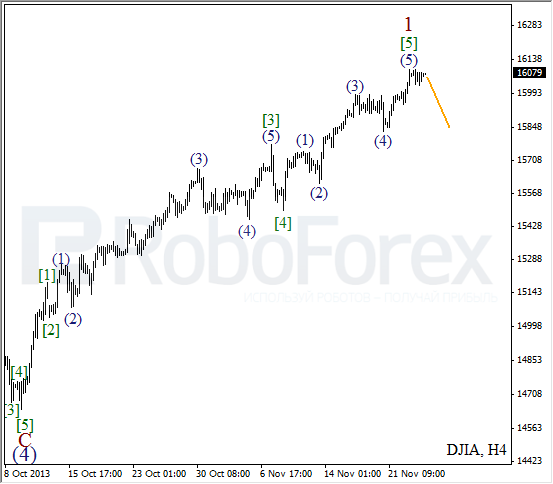
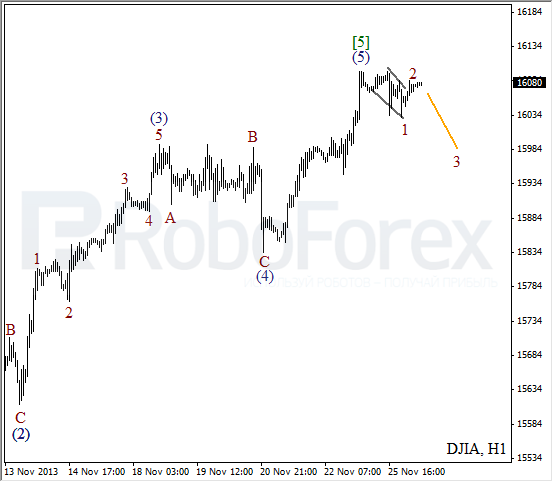
More detailed new wave structure is shown on H1 chart. Possible, after finishing wave (5) of [5], price formed bearish wedge pattern inside wave 1. Later, after local correction, instrument may continue falling down inside the third wave.
Crude Oil
Oil is still being controlled by bears. Probably, after finishing wave (4), price formed initial descending impulse inside wave (5). Instrument may break minimum in the middle of the week.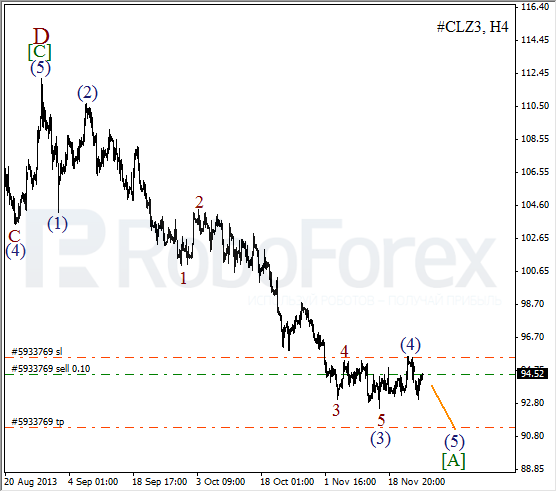
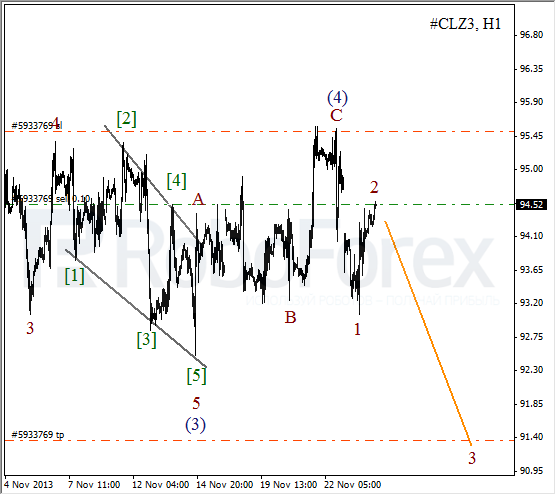
As we can see at the H1 chart, Oil formed zigzag pattern inside wave (4). On minor wave level, instrument is forming wave 2 and has almost eliminated the gap occurred during the market opening on Monday. After completion of the first descending wave inside wave 3, I’m planning to increase my short position.
RoboForex Analytical Department
Attention!
Forecasts presented in this section only reflect the author’s private opinion and should not be considered as guidance for trading. RoboForex bears no responsibility for trading results based on trading recommendations described in these analytical reviews.