Wave Analysis 04.12.2012 (DJIA Index, Crude Oil)
04.12.2012
Analysis for December 4th, 2012
DJIA Index
We may assume that the Index has already finished forming wave [2]. Earlier the price completed divergent wedge pattern inside the first wave. Most likely, one of these days the instrument will form an initial descending impulse inside wave (1).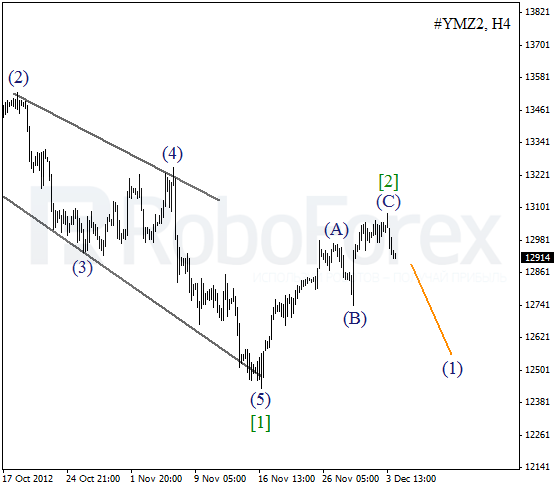
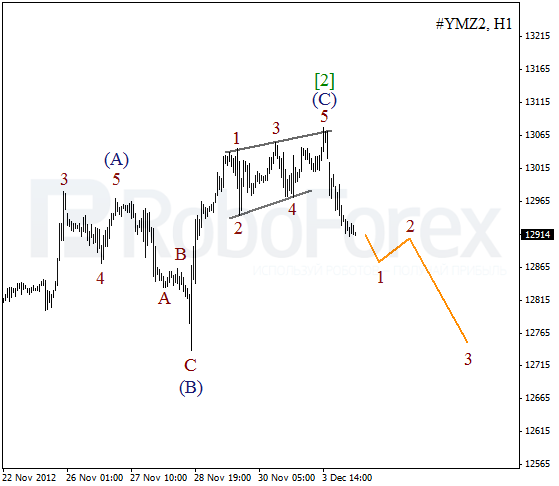
As we can see at the H1 chart, wave (C) was finished in the form of diagonal triangle pattern. On the minor wave level the price is forming wave 1. In the near term, we can expect the Index to continue falling down.
Crude Oil
It looks like yesterday Oil finished double zigzag pattern inside wave (2). At the moment the price is starting the formation of the third wave. The target for the bears for the next several days is at the level of $75 per barrel of Light Sweet.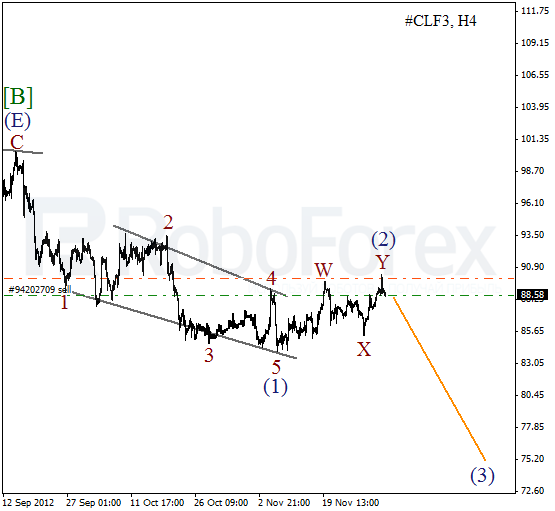
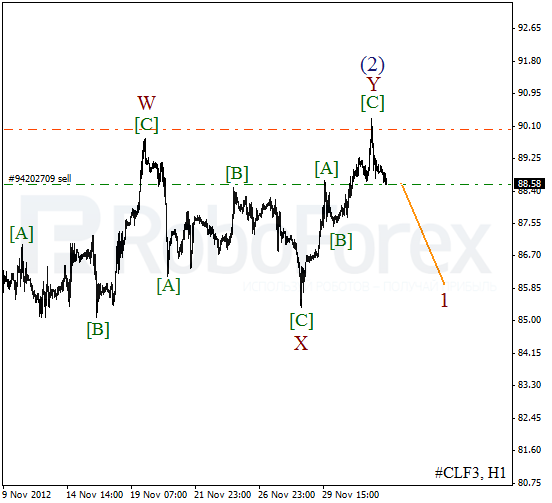
More detailed wave structure is shown on the H1 chart. Yesterday the price finished zigzag pattern inside wave Y. Right now the market is starting the formation on an initial impulse inside wave 1. During the day the instrument may continue moving downwards.
RoboForex Analytical Department
Attention!
Forecasts presented in this section only reflect the author’s private opinion and should not be considered as guidance for trading. RoboForex bears no responsibility for trading results based on trading recommendations described in these analytical reviews.