Wave Analysis 19.11.2012 (DJIA Index, Crude Oil)
19.11.2012
Analysis for November 19th, 2012
DJIA Index
The Index completed a descending wedge pattern. After finishing a local correction, the price formed an initial impulse inside wave (1). The short-term forecast is shown on the chart. Later the instrument is expected to start falling down inside the third wave.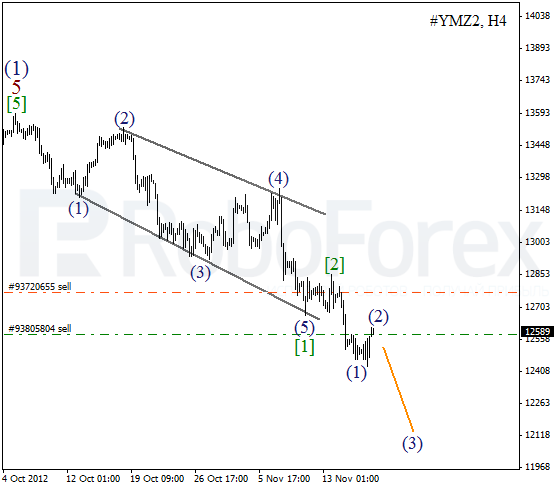
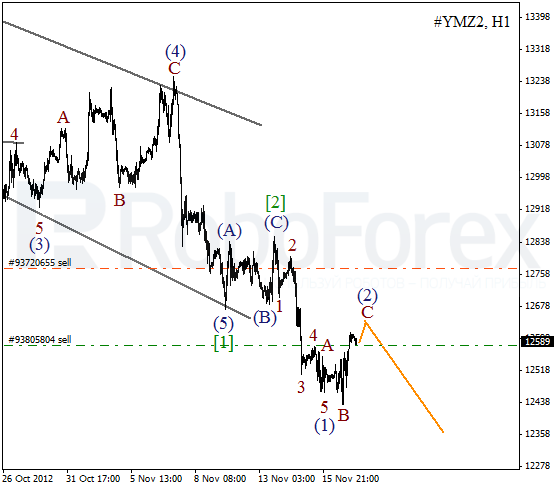
More detailed wave structure is shown on the H1 chart. It looks like at the moment the Index is forming flat pattern with wave C inside it. The price is expected to start a new descending movement during the day.
Crude Oil
Oil formed a bearish wedge pattern. At the moment the instrument is completing the second wave. We can’t exclude a possibility that the price may start a new descending movement inside the third wave during the next several days. However, while a local correction is taking place, I’ve decided to open only a sell order.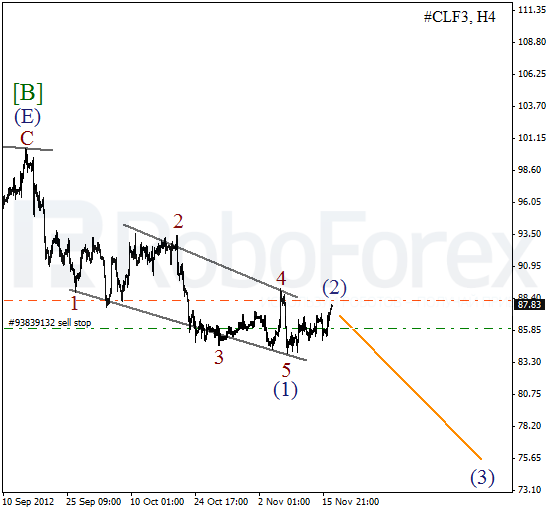
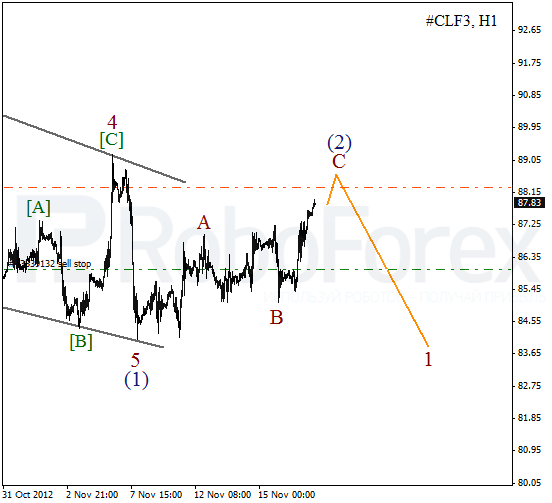
As we can see at the H1 chart, price is forming wave (2) in the form of zigzag pattern. On the minor wave level the price completed wave B in the form of flat pattern. The instrument may continue growing up a bit during Monday, but later it is expected to make a reverse.
RoboForex Analytical Department
Attention!
Forecasts presented in this section only reflect the author’s private opinion and should not be considered as guidance for trading. RoboForex bears no responsibility for trading results based on trading recommendations described in these analytical reviews.