Wave Analysis 06.12.2013 (DJIA Index, Crude Oil)
06.12.2013
Analysis for December 6th, 2013
DJIA Index
Index is still being corrected. Possibly, wave 2 is taking the form of zigzag pattern. In the near term, after completing wave [B], price may move downwards for a while inside wave [C] of 2.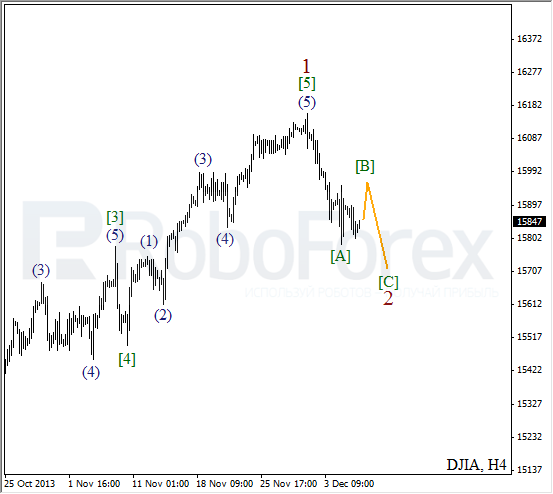
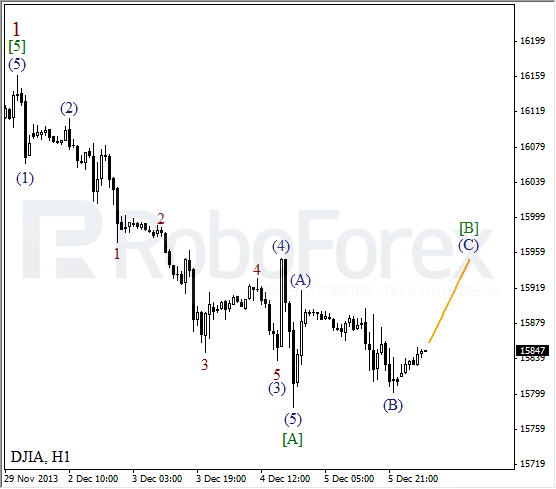
More detailed new wave structure is shown on H1 chart. Probably, price is forming ascending zigzag pattern. During the day, instrument is expected to start new ascending movement inside wave (C) of [B], which later may result in reverse and new descending structure.
Crude Oil
After completing impulse inside wave [A], Oil started new correction. Probably, right now price is forming zigzag pattern inside wave [B]. During the next several weeks, local growth may continue.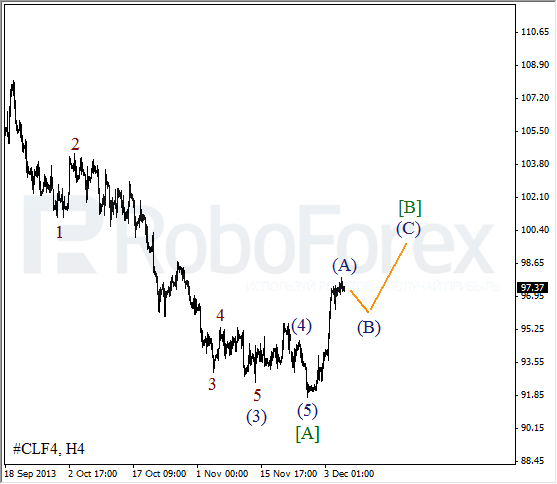
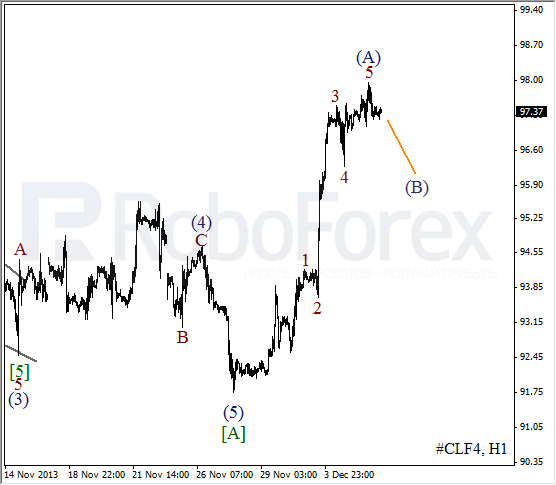
As we can see at the H1 chart, instrument completed impulse inside wave (A). Most likely, in the future price will start new, deeper and more serious correction inside (B).
RoboForex Analytical Department
Attention!
Forecasts presented in this section only reflect the author’s private opinion and should not be considered as guidance for trading. RoboForex bears no responsibility for trading results based on trading recommendations described in these analytical reviews.